Blog · Research · SeNMo · 10 min read
SeNMo: learning pan-cancer prognosis from sparse multi-omics data
A self-normalizing network trained on five omics layers plus clinical variables from TCGA, then adapted to predict survival, cancer type and TLS ratio.
Contents
A tumor’s molecular profile is spread across several assays: RNA sequencing, DNA methylation arrays, miRNA sequencing, protein arrays and somatic mutation calls. Each is high-dimensional, each has its own scale, and in real cohorts many patients are missing one or more of them. Yet the questions people ask are simple: how long is this patient likely to live, where did the tumor start, and what does the immune environment look like?
SeNMo, our self-normalizing multi-omics network, tries to answer those questions with one model. It is a deep network trained on five omics layers plus four clinical variables from 33 cancer types in The Cancer Genome Atlas (TCGA), and the same backbone is then fine-tuned for other cohorts and tasks.1 Asim Waqas led the study as first and corresponding author; I co-developed SeNMo and share first authorship with him.
In short
- Problem: omics data are wide, noisy and often incomplete, and most models cover one data type or one cancer.
- What we built: SeNMo, one network trained on 80,697 molecular and clinical features from 33 TCGA cancer types.
- Survival: a concordance index (C-index) of 0.758 on 2,754 held-out patients, where 0.5 is chance and 1.0 is a perfect ranking.
- Other tasks: 99.8% accuracy on 33-way cancer type classification and, after fine-tuning, tertiary lymphoid structure (TLS) predictions that did not differ significantly from manual annotations.
Why multi-omics is hard
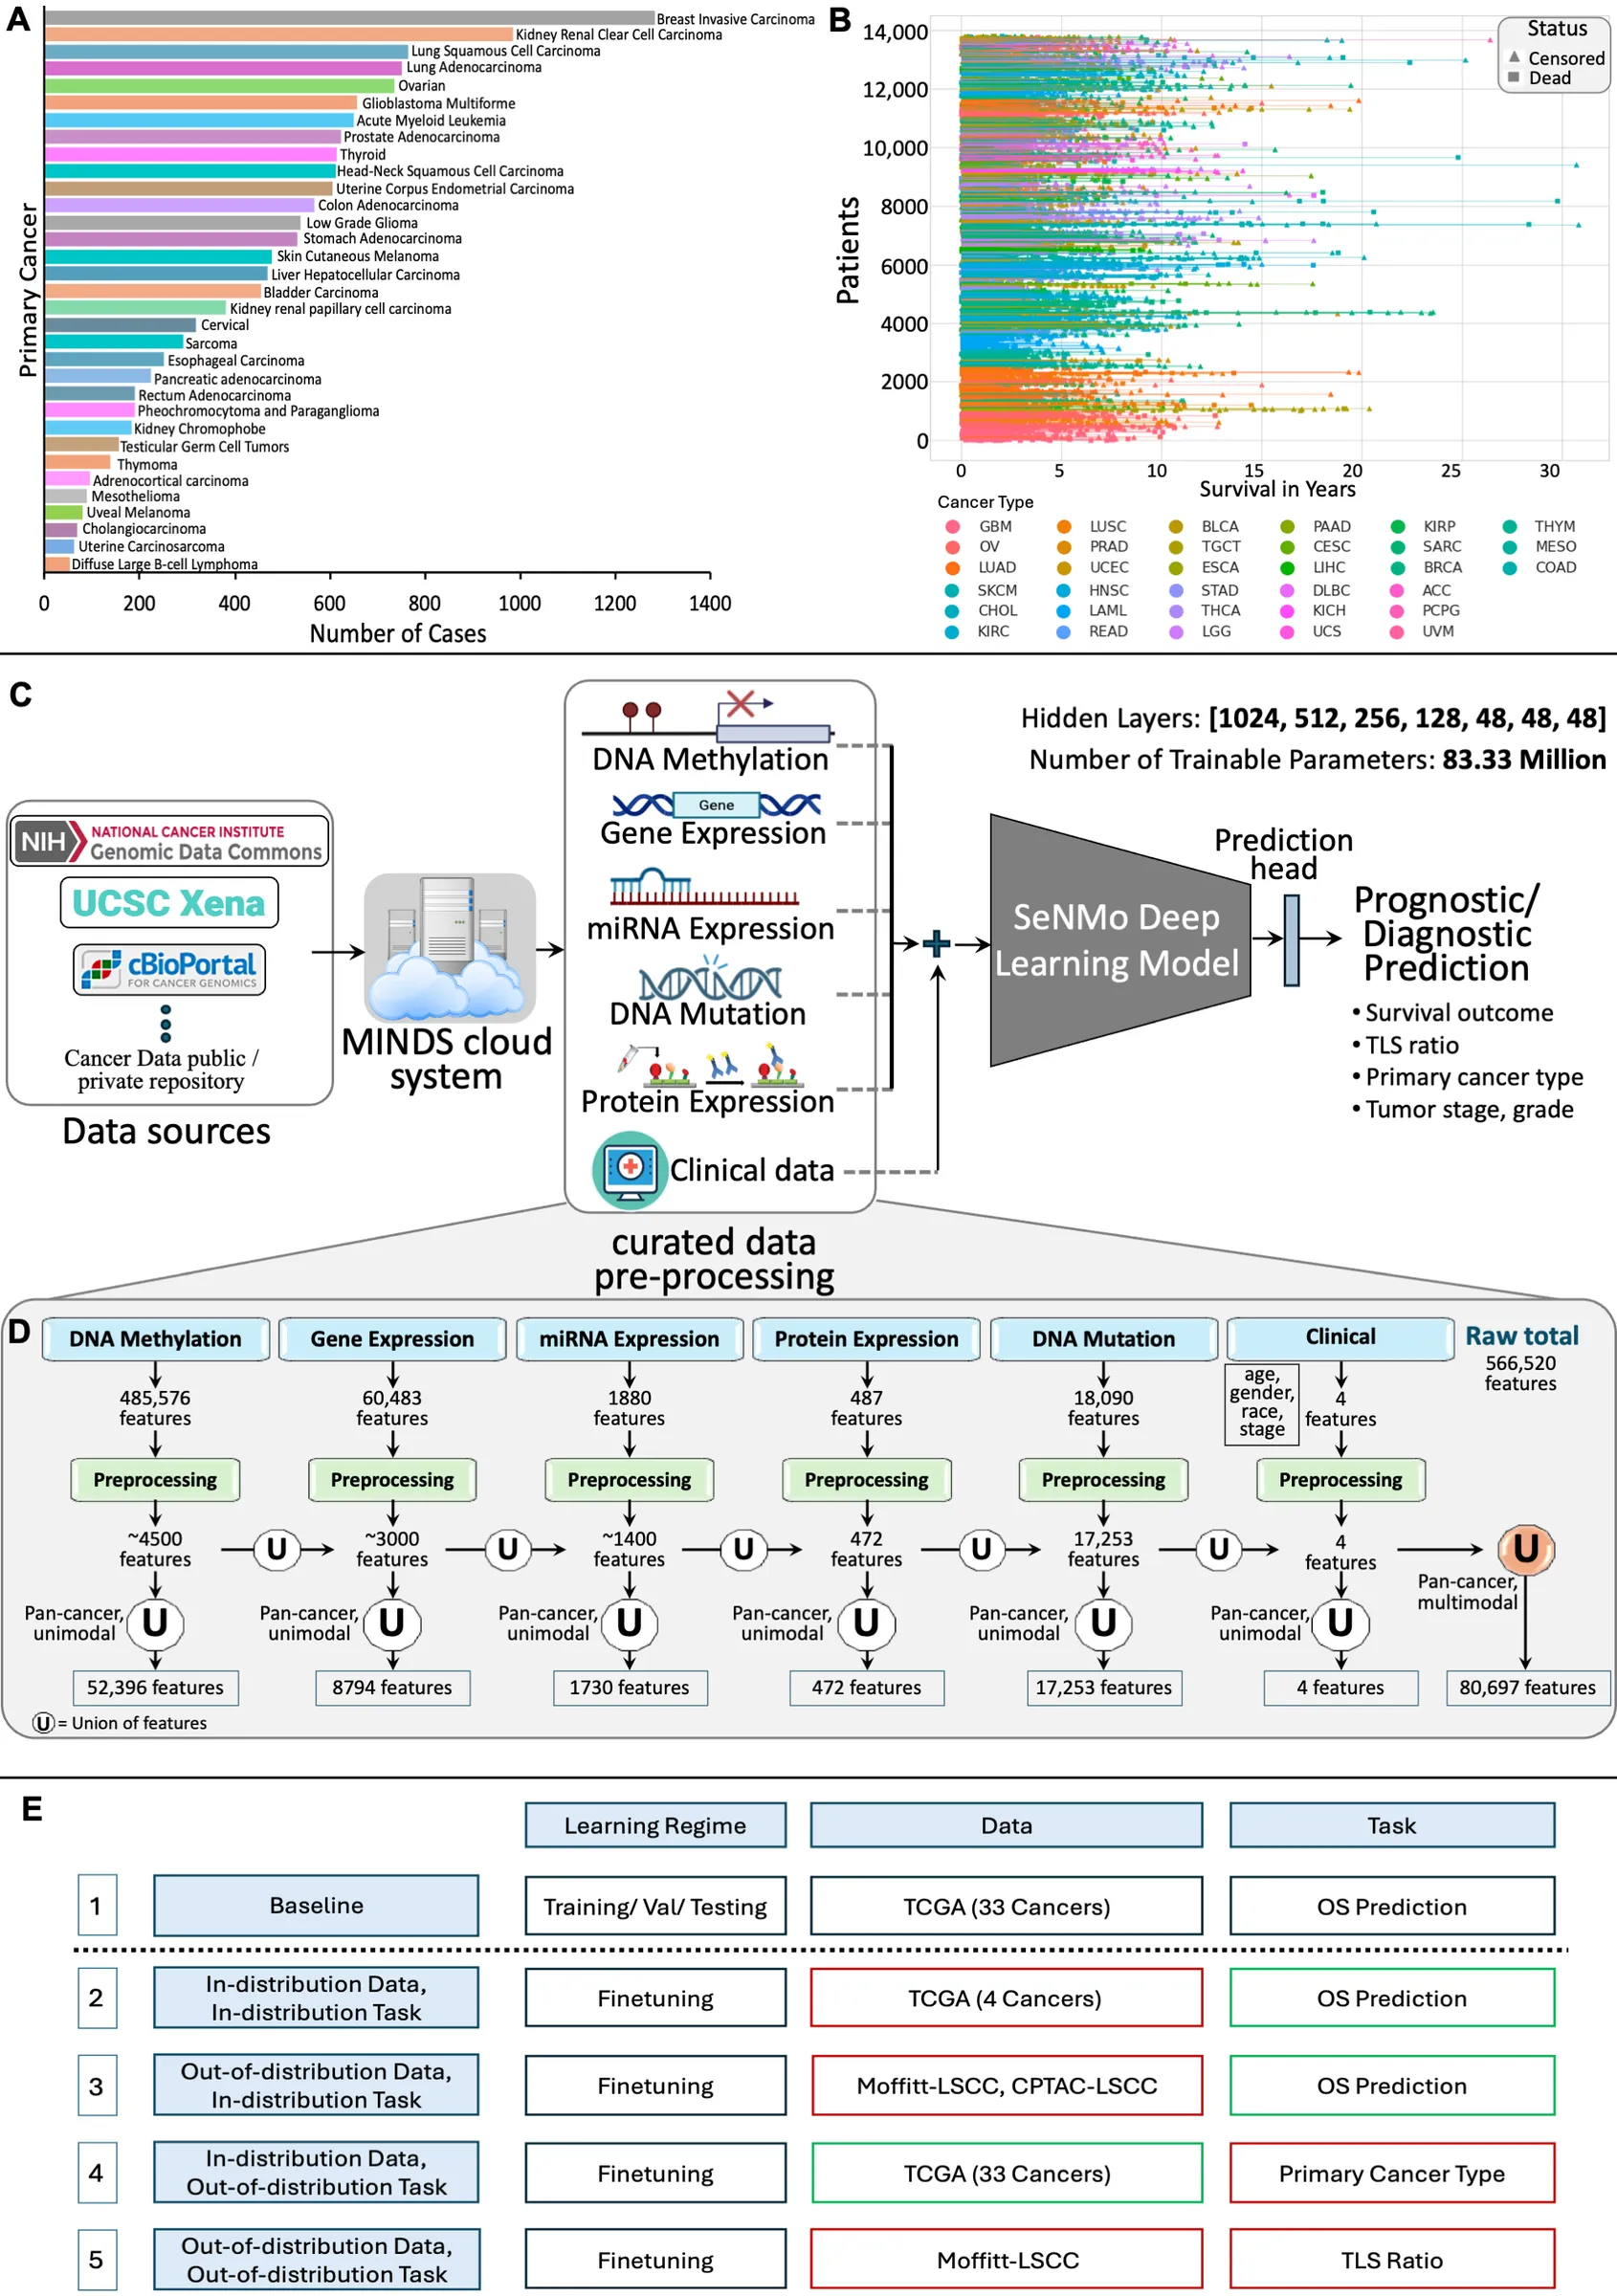
Multi-omics is a textbook “big P, small n” problem. TCGA methylation data alone has 485,576 CpG sites per sample, and gene expression has 60,483 features, while individual cancer types in our TCGA cohort range from 51 to 1,260 cases. The data also carry correlated features, different measurement scales, technical noise and missing values, within and across datasets.
Standard architectures each struggle here. Plain feedforward networks overfit and are sensitive to perturbations during training. CNNs rely on a spatial-invariance assumption and a fixed input size, and they handle sparse omics inputs inefficiently. Transformers are built around attention over sequences, which suits highly sparse molecular vectors poorly. Many existing multi-omics models also cover only one omics layer or one cancer type, or need heavy feature engineering for each modality.
The approach
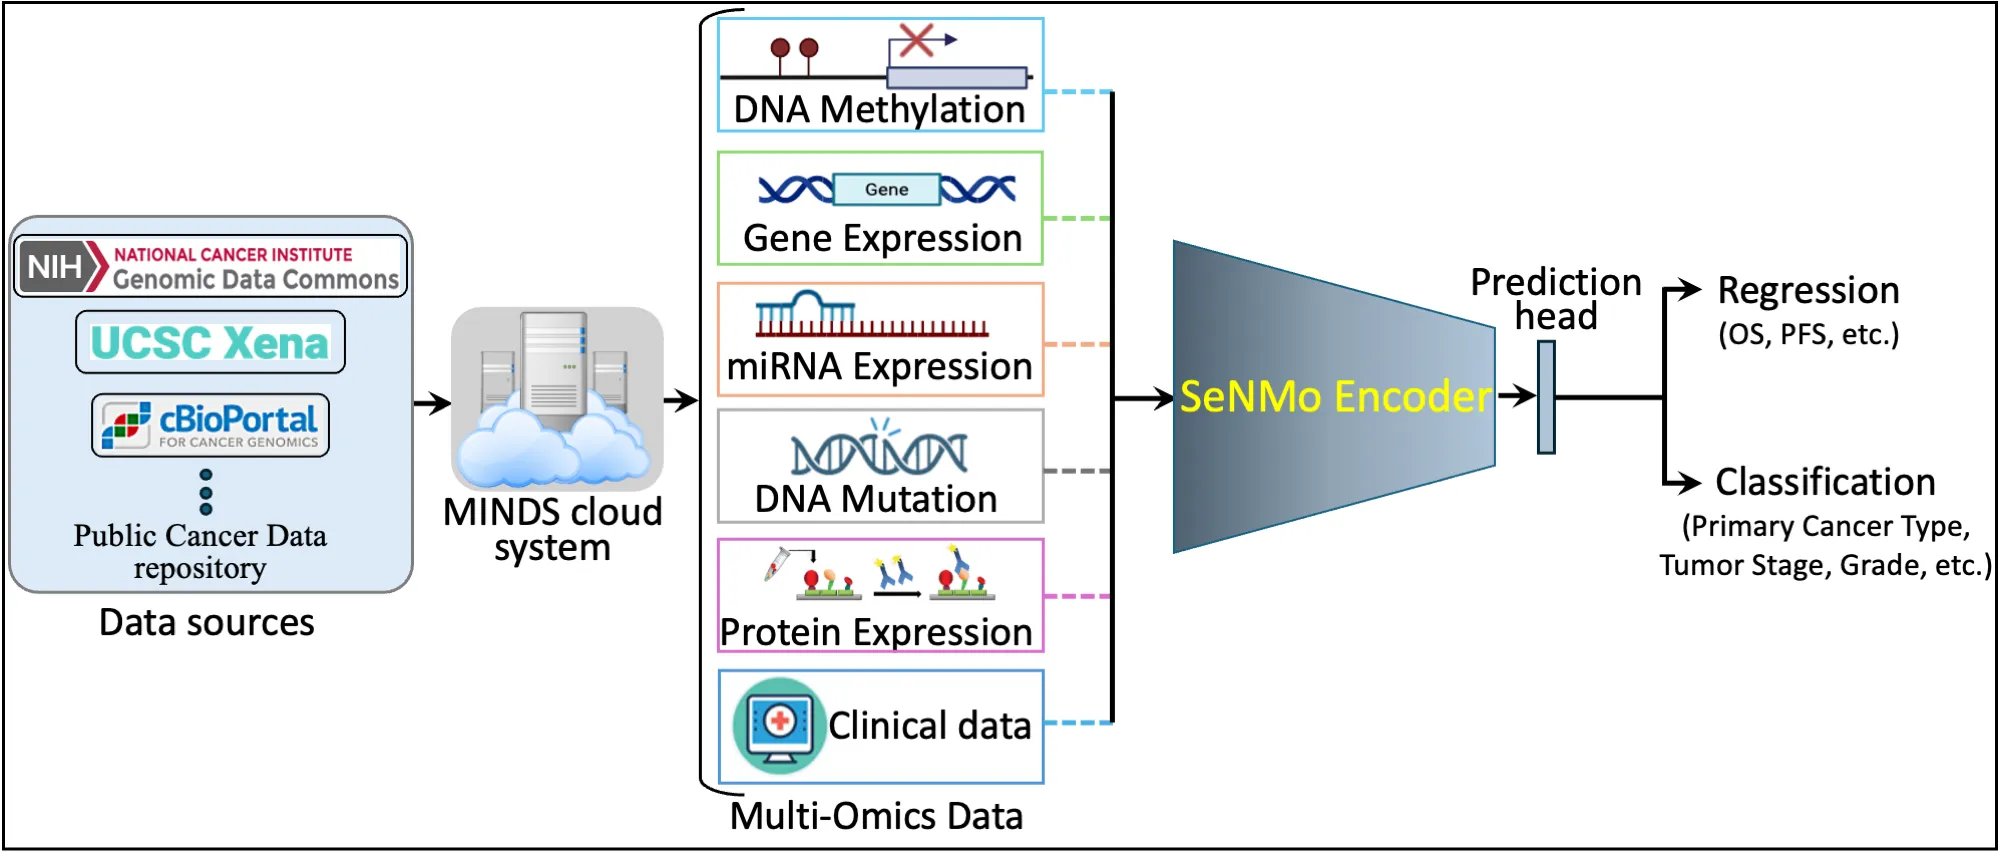
We combined three ideas. First, use our MINDS framework to assemble a machine-learning-ready pan-cancer cohort from TCGA through the GDC and the UCSC Xena portal.2 Second, reduce every modality with simple, reproducible filters and concatenate the result into one fixed-length vector per patient (early fusion). Third, learn from that vector with a network whose layers keep activations close to zero mean and unit variance, so a deep model can train stably on very wide, sparse input.
How it works
One vector per patient
Each molecular modality went through the same sequence of filters, with thresholds set per modality. We removed features that were NaN in all samples, dropped near-constant features with a 0.998 threshold, removed duplicate features and filtered low-variance ones. For gene expression we also kept only features with log-transformed expression above 7 (127 FPKM). Missing values within a modality and cancer type were imputed with the feature mean; missing features across cancers and modalities were zero-padded.
| Modality | Raw features | After preprocessing |
|---|---|---|
| DNA methylation | 485,576 | 4,006 to 4,762 per cancer type; 52,396 combined |
| Gene expression (RNA-seq) | 60,483 | 772 to 3,671 per cancer type; 8,794 combined |
| miRNA expression | 1,880 | 967 to 1,460 per cancer type; 1,730 combined |
| Protein expression (RPPA) | 487 | 472 |
| Somatic mutation | 18,090 | 17,253 |
Self-normalizing blocks
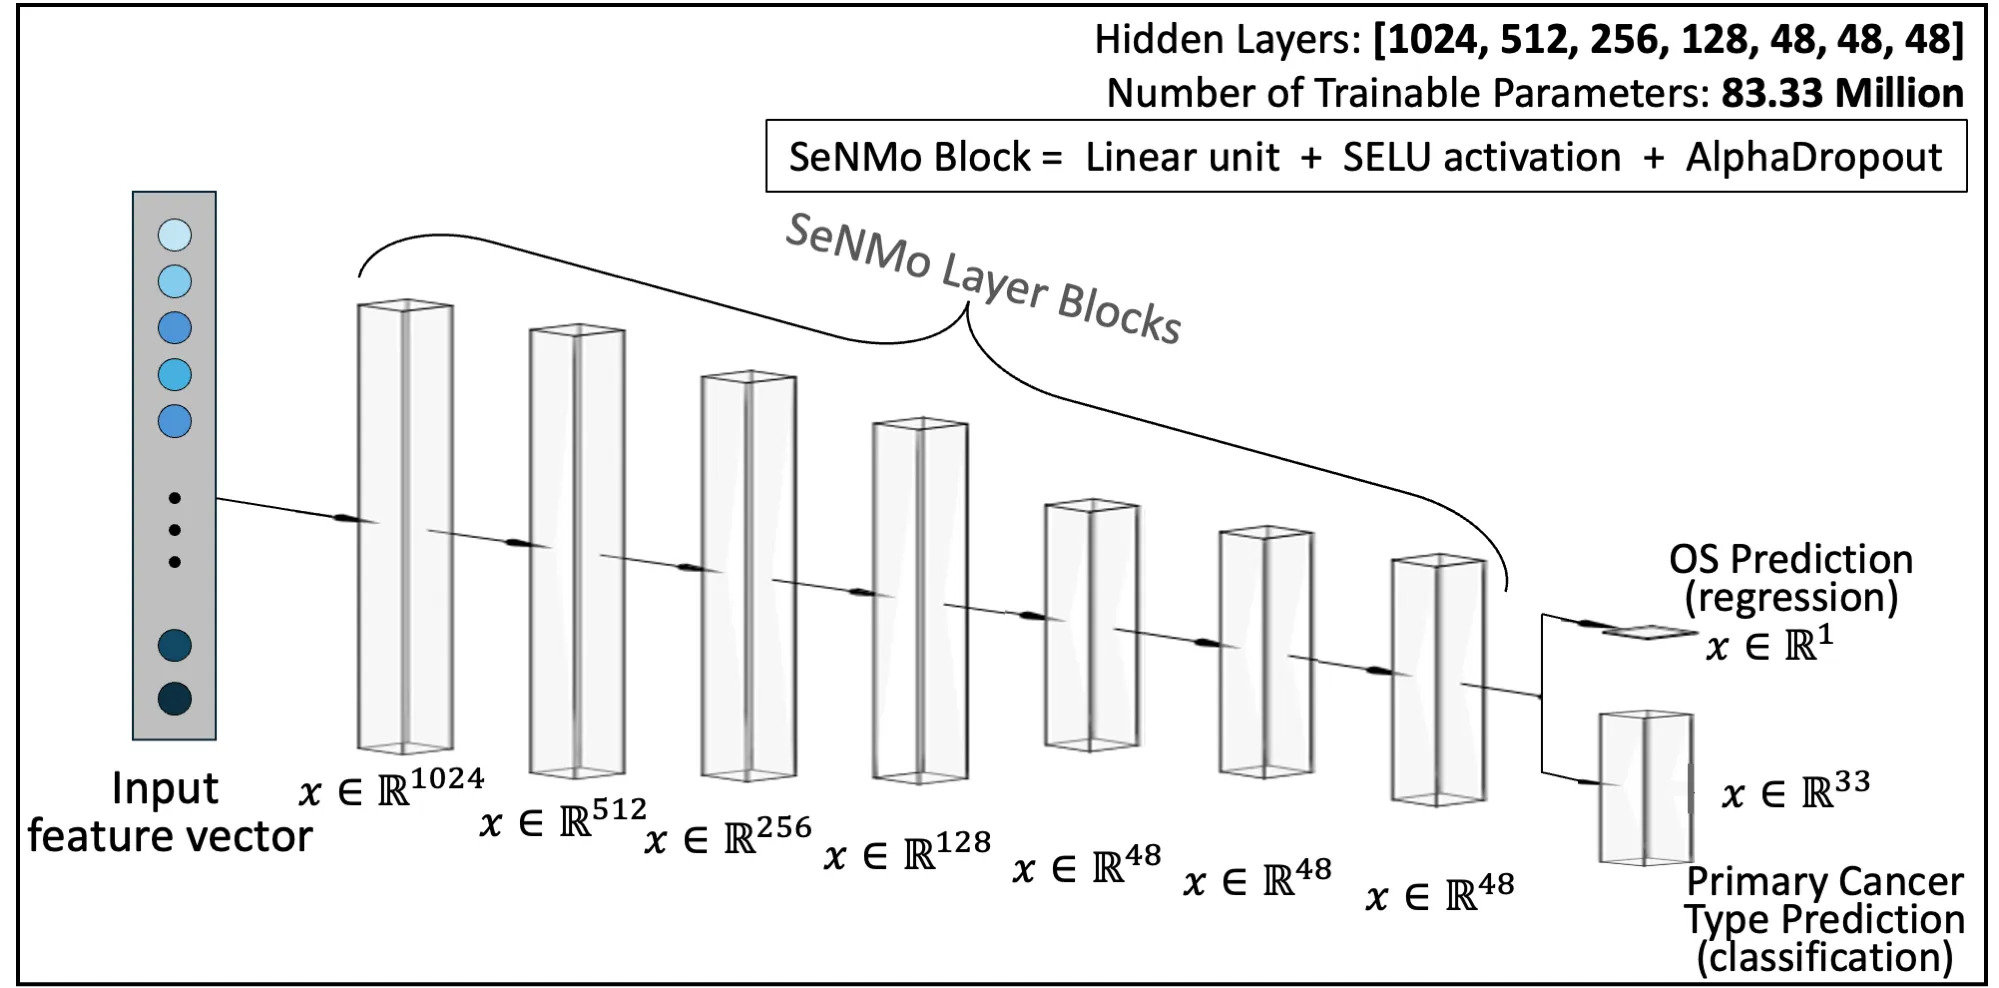
Each SeNMo block is a linear layer followed by a scaled exponential linear unit (SELU) and Alpha-Dropout. SELU is defined as
with and , the values the paper reports. Klambauer and colleagues showed that with these constants, activations that start near zero mean and unit variance converge to that fixed point as they pass through many layers.3 Alpha-Dropout is a dropout variant that preserves this property. The final SeNMo encoder has seven hidden layers, ends in a 48-dimensional patient embedding and has 83.33 million parameters.
Training objective
Overall survival is modeled with the negative Cox partial log-likelihood. For a batch of patients with predicted log-hazards and event indicators :
where if patient is still at risk at patient ‘s event time. The full objective is a weighted sum , adding cross-entropy for cancer type and an L1 penalty on the weights. For TLS ratio regression we used a Huber loss.
Data and evaluation
For survival, each cancer type was split 80/20 into a training-validation set and a held-out test set. The pooled training-validation cohort had 11,050 patients, trained with 10-fold cross-validation, and the pooled test set had 2,754 patients. That gave ten checkpoints. We report both their mean test C-index and an ensemble that averages their predictions.
We ran about 400 hyperparameter configurations with Weights & Biases. Training the final model took about 11 hours on one Tesla V100 (32 GB), and fine-tuning on a cohort of around 150 patients took about 15 minutes. External evaluation used two lung squamous cell carcinoma (LSCC) cohorts: the public CPTAC-LSCC proteogenomic cohort and an independent 108-patient cohort from Moffitt Cancer Center.
Results
- C-index, held-out TCGA test set (ensemble)
- 0.758
- patients in the pooled test set
- 2,754
- 33-class cancer type accuracy
- 99.8%
- C-index, CPTAC-LSCC after fine-tuning (ensemble)
- 0.730
Survival across modalities
The full six-modality model scored a mean C-index of 0.757 across the ten checkpoints and 0.758 as an ensemble. To see how much each data layer contributes, we retrained on subsets of the modalities. Performance fell off gradually rather than collapsing: gene expression alone still reached 0.728.
C-index (held-out test, ensemble)
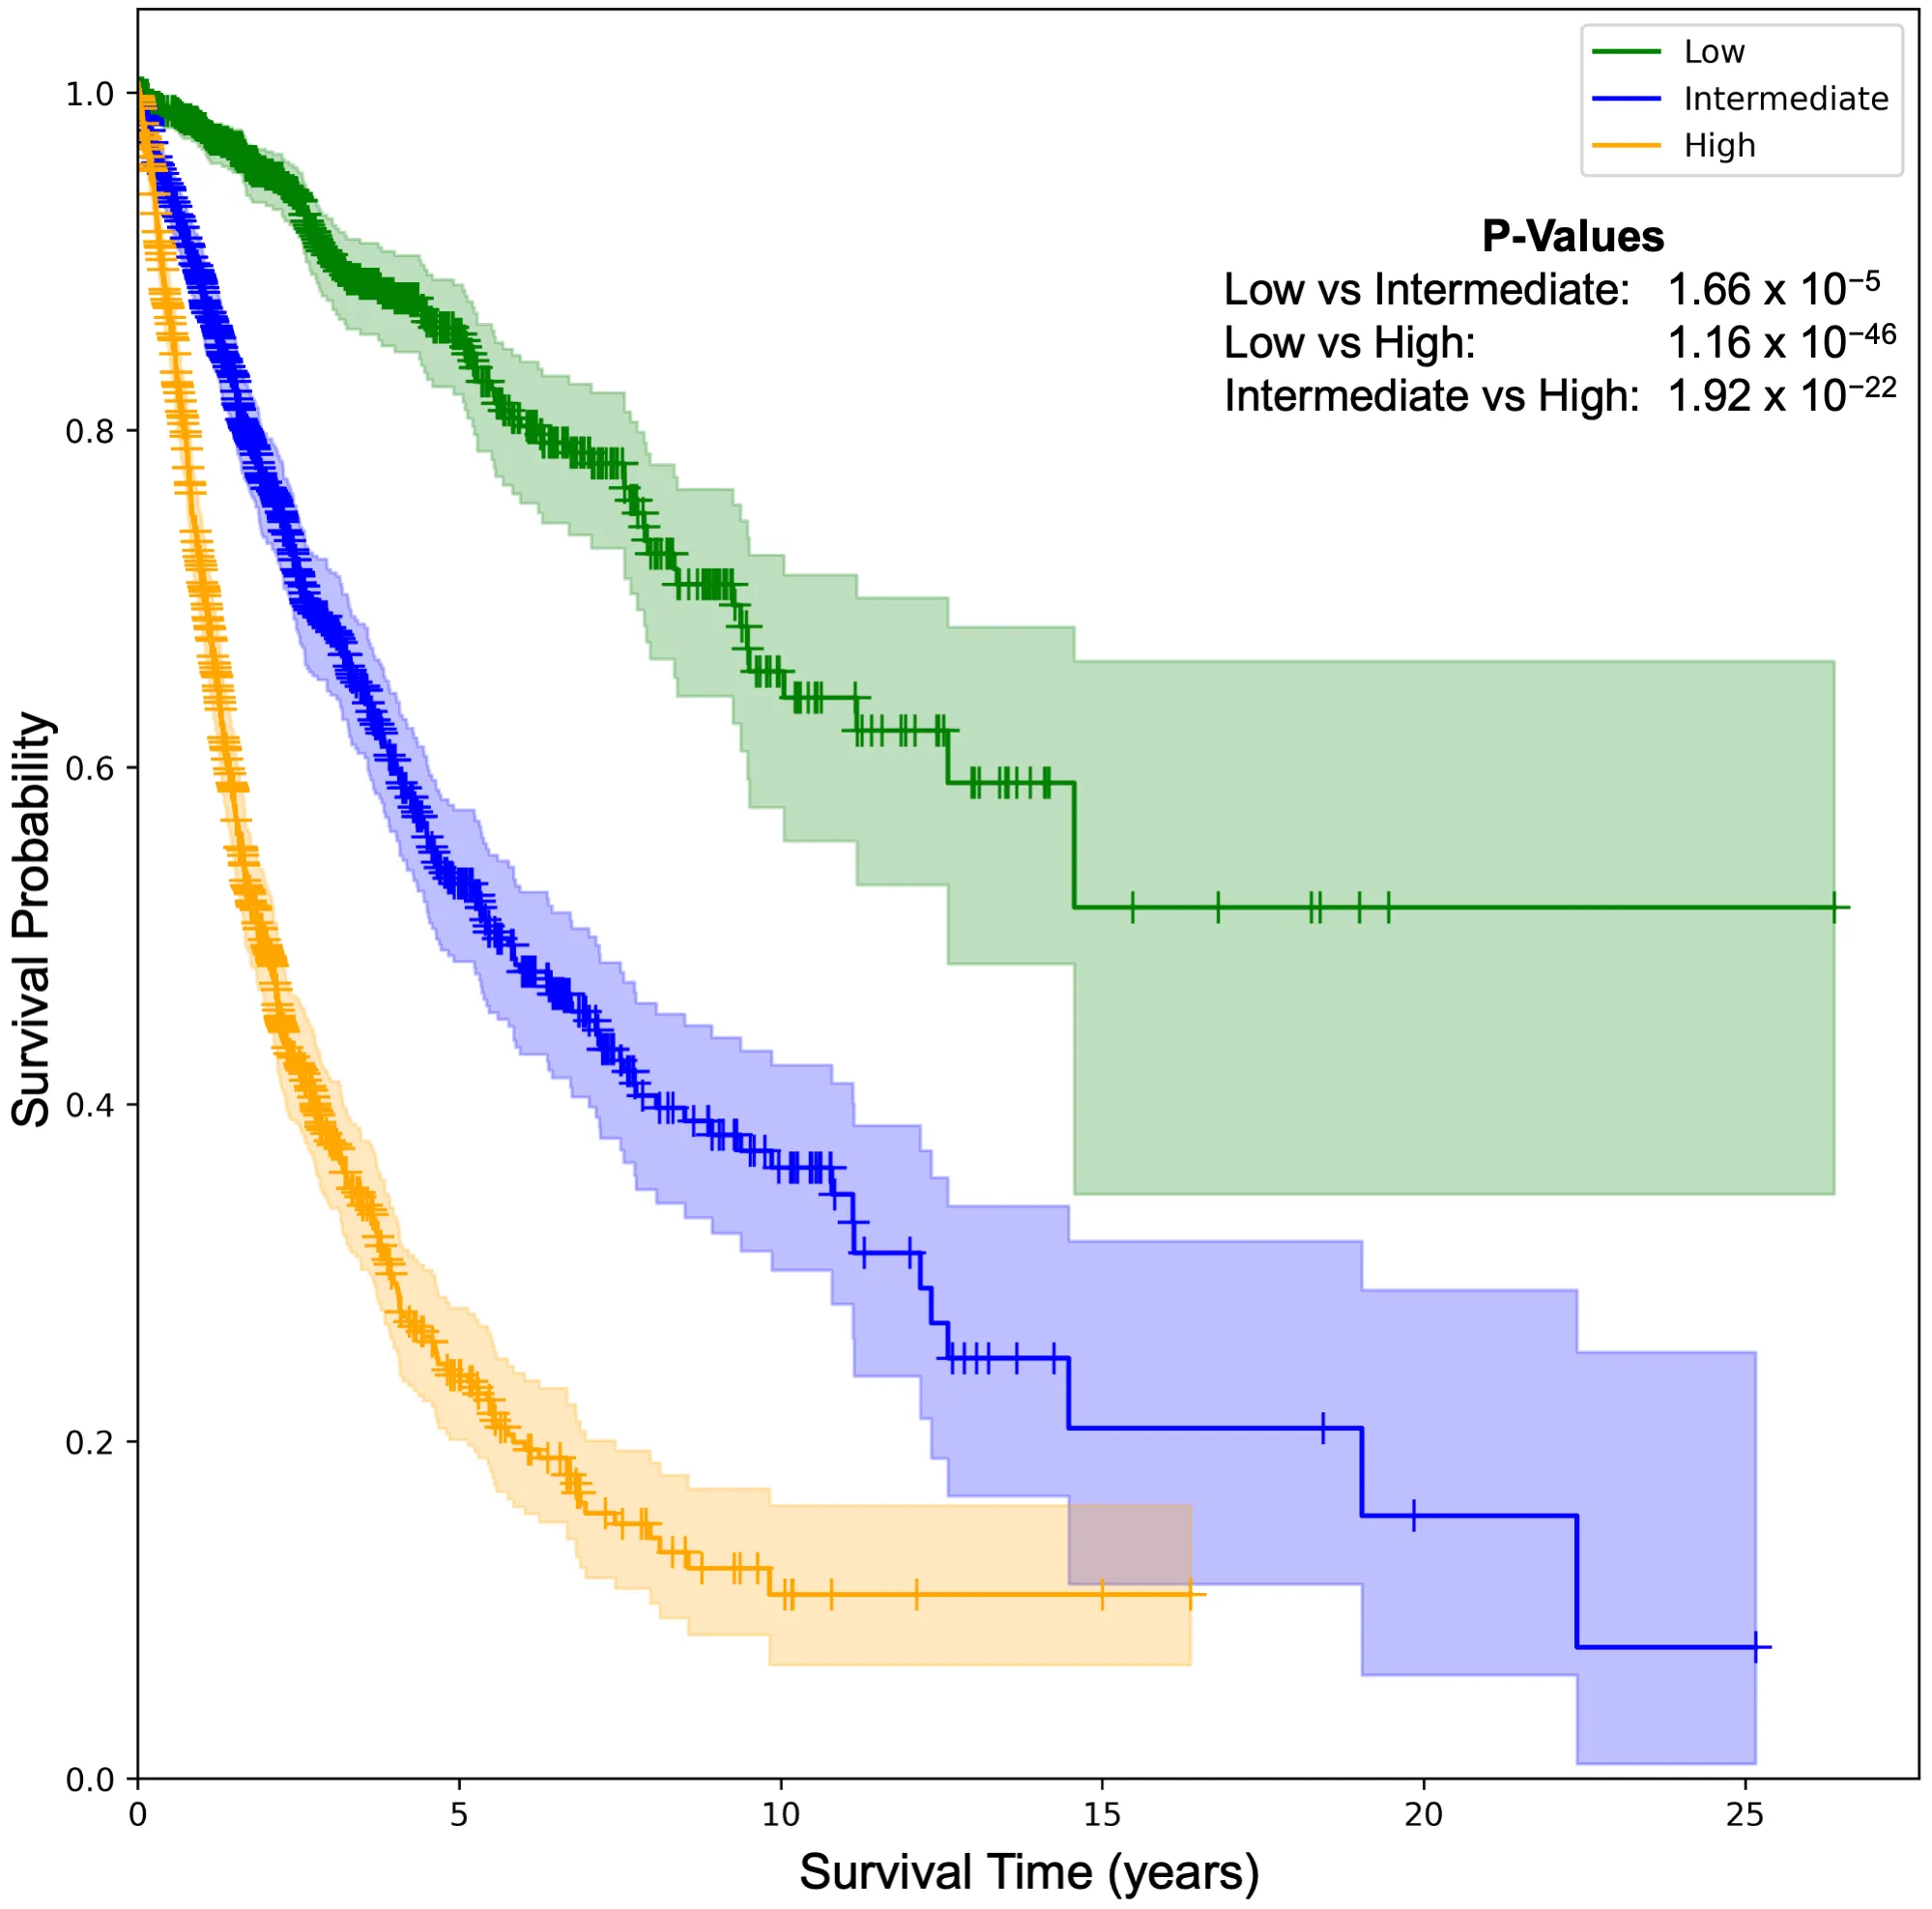
Splitting the pooled test set into terciles of predicted hazard gave clearly separated Kaplan-Meier curves (log-rank for low versus high risk). The integrated Brier score, which reflects both discrimination and calibration, was 0.125 in cross-validation and 0.158 on the held-out test set, against a non-informative reference of 0.25.
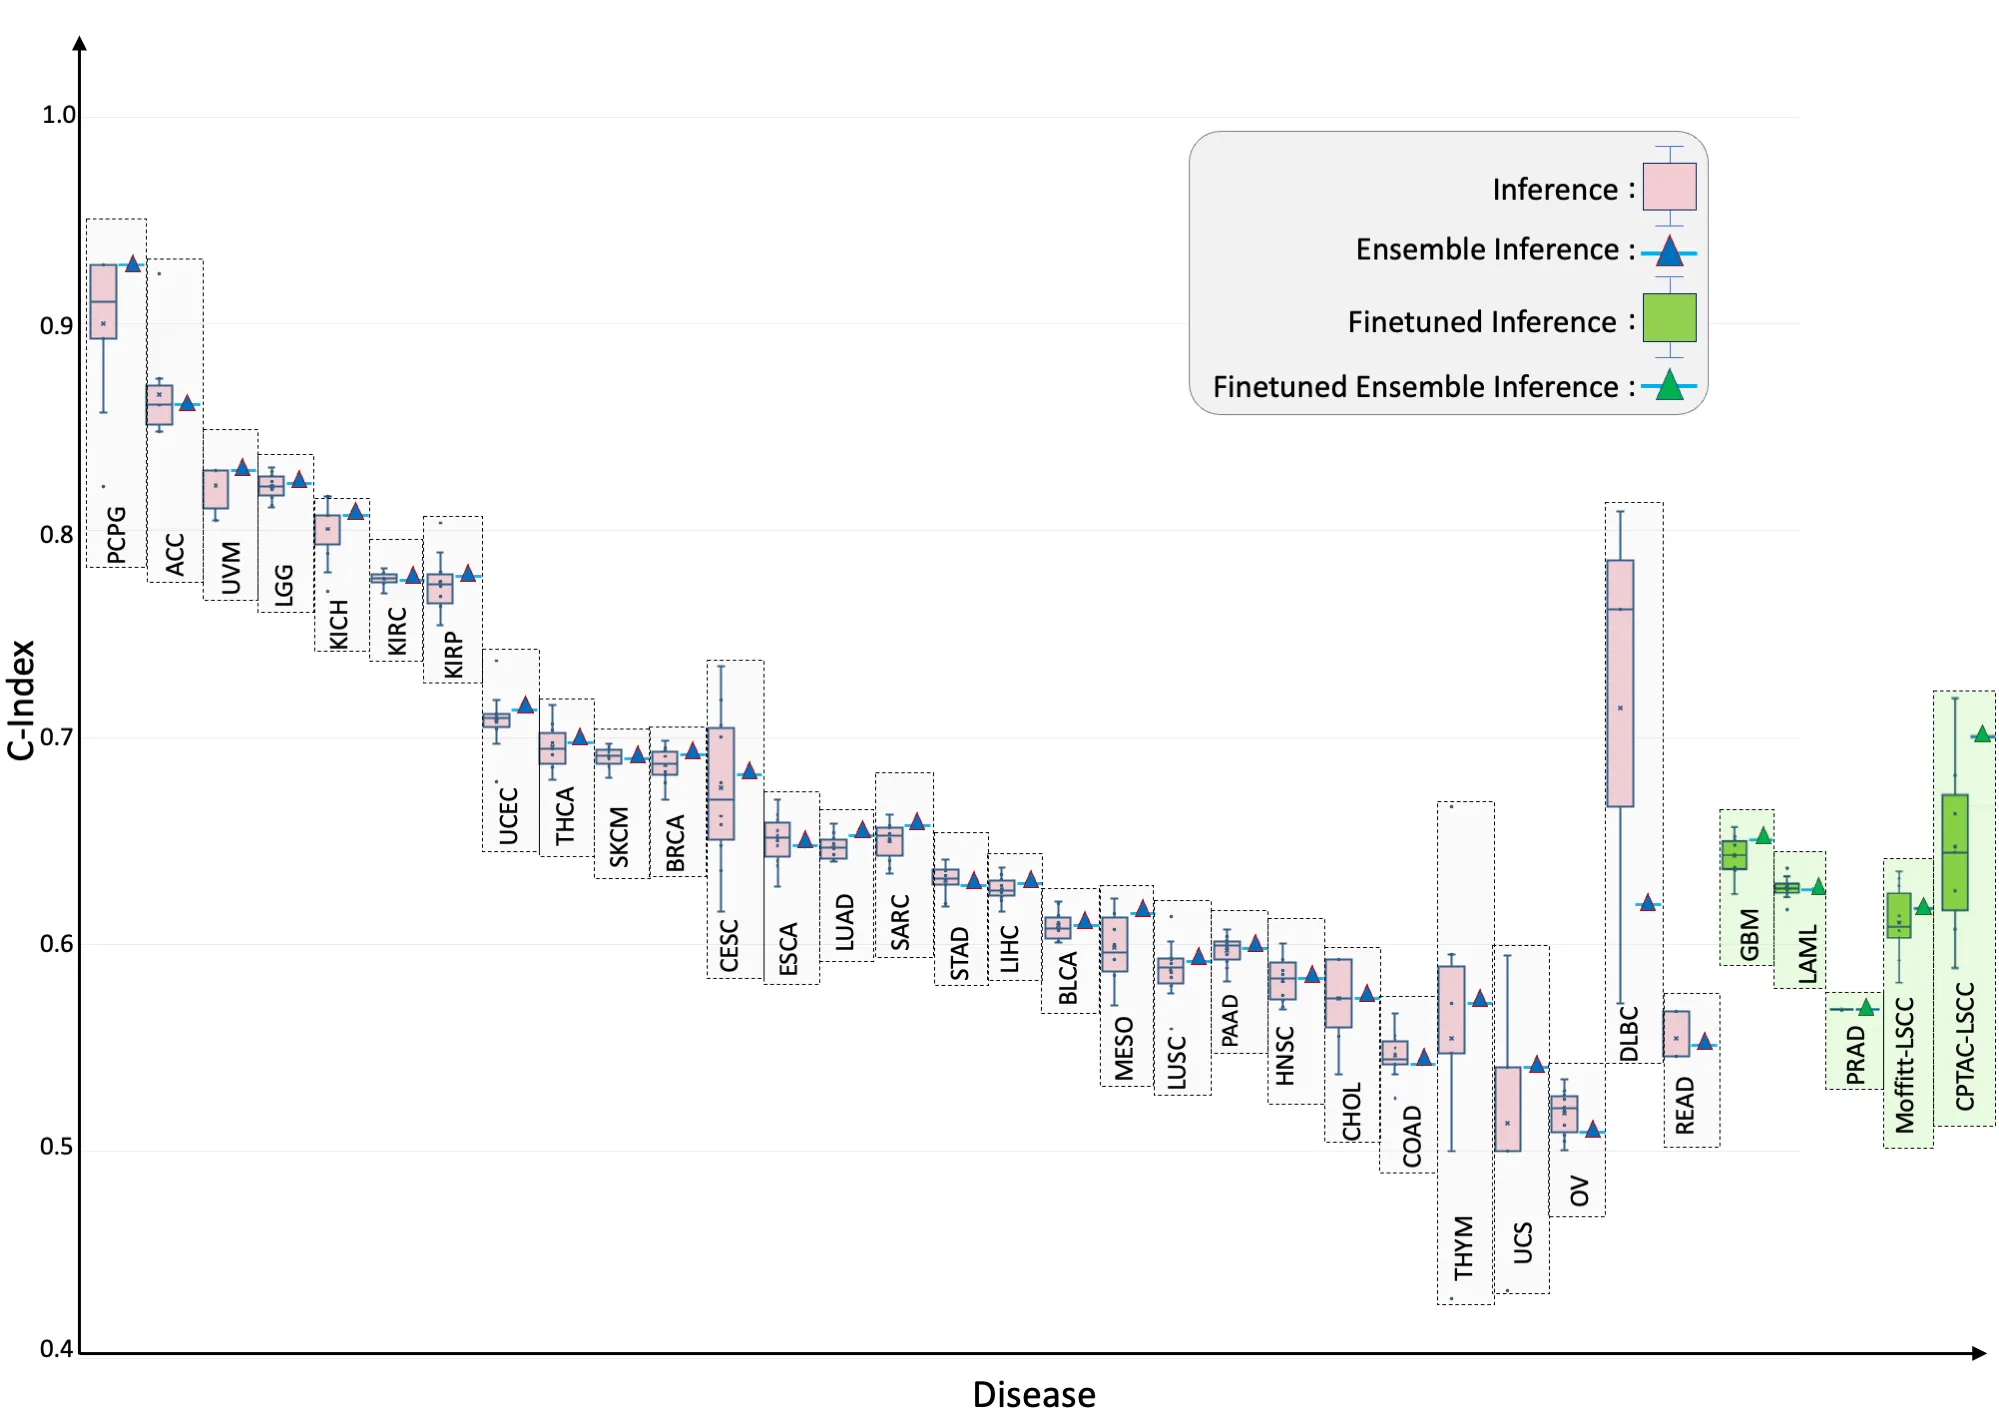
Evaluated one cancer at a time, the pan-cancer model gave statistically significant C-indices for 29 of 33 cancer types, with the best result in pheochromocytoma and paraganglioma (0.900 test, 0.929 ensemble). Four cohorts (GBM, LAML, PRAD and TGCT) were not significant at first. A ten-epoch fine-tune brought GBM, LAML and PRAD to 0.650, 0.626 and 0.542 (ensemble), while TGCT remained a failure case.
External cohorts
Zero-shot transfer did not work well. On CPTAC-LSCC the model was at chance level, and on the Moffitt cohort it was only modestly above. A short fine-tune changed that:
| Cohort | Zero-shot | After 10-epoch fine-tune |
|---|---|---|
| CPTAC-LSCC | 0.48 / 0.50 | 0.677 / 0.730 |
| Moffitt-LSCC | 0.581 / 0.590 | 0.647 / 0.656 |
Fine-tuning an MLP backbone
Our first attempts at fine-tuning ran into catastrophic forgetting: the model would not converge on either new cohort, especially when we froze some hidden layers and trained the rest at lower learning rates. What worked was unfreezing every layer and training for just 10 epochs with a very small learning rate (), high weight decay and dropout of 0.35.
Cancer type and TLS
For diagnosis, we framed tissue of origin as a 33-way classification. We removed stage from the clinical inputs because its distribution differs across cancers and would leak the label. SeNMo reached 99.8% accuracy on the test set for both single-checkpoint and ensemble inference. The remaining errors were between biologically related pairs such as colon and rectal adenocarcinoma.
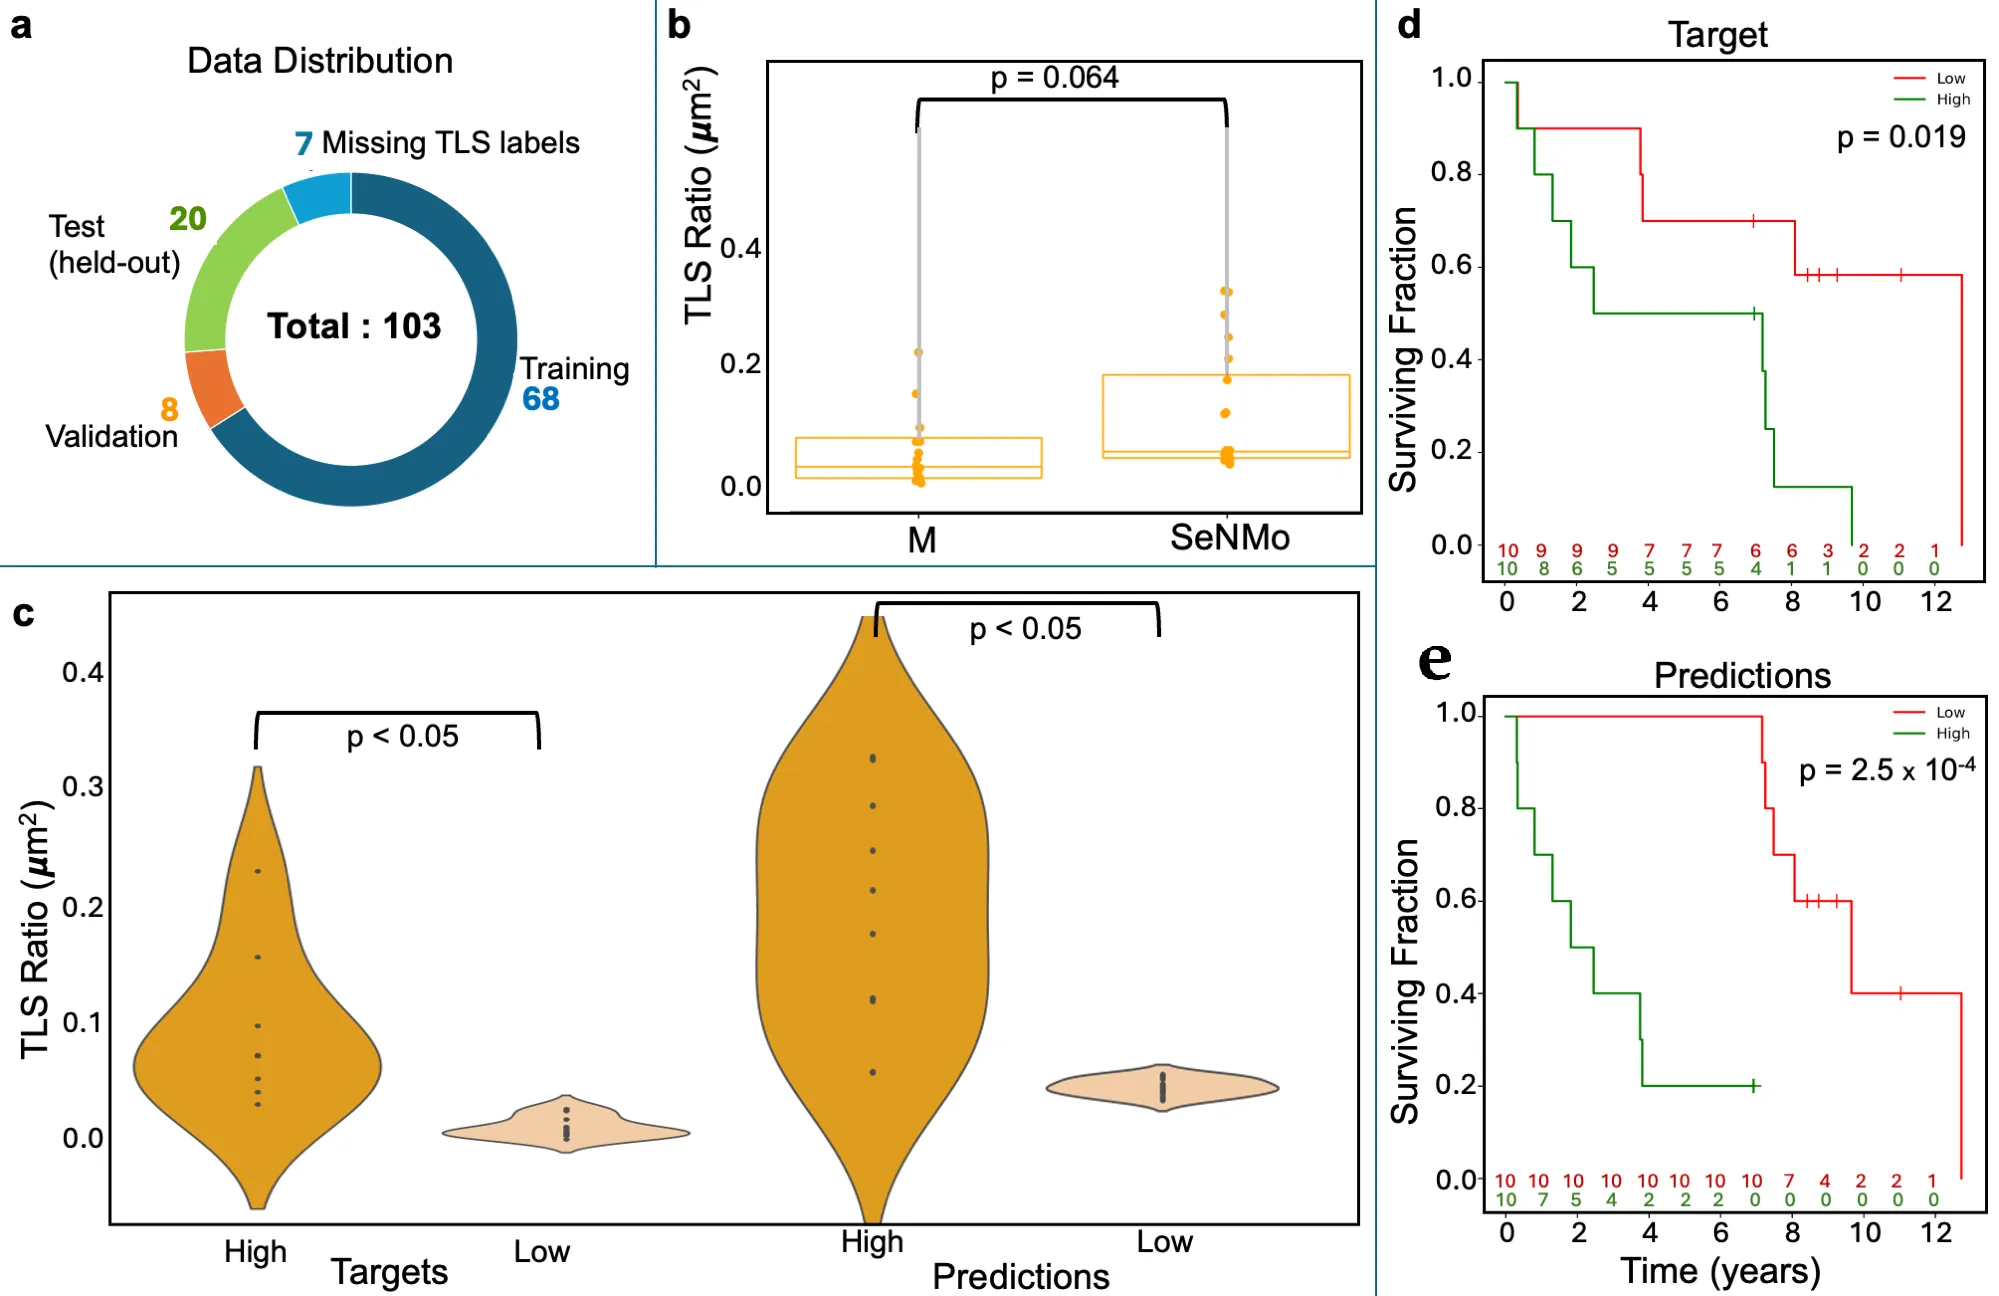
For the immune microenvironment, we fine-tuned the backbone on the Moffitt LSCC cohort to regress the tissue-level TLS ratio (segmented TLS area divided by total tissue area). The labels came from H&E and CD20-stained whole-slide images analyzed in Visiopharm with manual review. Using cross-validation on 76 patients and a held-out set of 20, SeNMo’s predictions showed no significant difference from the manual annotations (paired comparison, ). Patients split into high and low TLS groups by SeNMo’s predictions had a stronger survival separation (log-rank ) than the split by manual labels ().
What we learned
One backbone trained for survival also carried enough signal for cancer type classification and, after fine-tuning, TLS regression. More modalities generally helped, and performance degraded gracefully as layers were withheld, down to gene expression alone. That matters because incomplete data is common in routine oncology practice. The ingestion step is also modular: an RNA-seq matrix processed with limma-voom or the DESeq2 variance-stabilizing transform can go into the same encoder without changing the network.
The limits are just as clear. Four cancer types started with low C-indices and TGCT never recovered, so a shared model can still miss features specific to one tumor type. External validation covered two cohorts, both lung squamous cell carcinoma, so broader claims about generalization need more histologies. The TLS labels came from an image-analysis pipeline with its own measurement noise. Zero-shot transfer was weak, and the backbone was prone to forgetting during fine-tuning.
The paper’s future directions are contrastive pre-training with synthetic modality dropout, spatial transcriptomics and digital pathology features, new inputs such as copy-number data, and prospective validation in molecular tumor boards.
The broader survival thread
SeNMo started as an AACR 2024 abstract and an arXiv preprint before the journal version.56 Two related projects in our group ask how best to combine modalities for survival prediction.
RMSurv. Dominic Flack (Rochester Institute of Technology), whom I mentored from August 2024 to February 2025, led Robust Multimodal Fusion for Survival Prediction in Cancer Patients with Dimah Dera; Asim Waqas, Ghulam Rasool and I contributed.7 RMSurv takes the opposite approach to SeNMo’s early fusion. It trains a separate discrete-time survival model for each modality (twenty 6-month bins over 10 years), then sets late-fusion weights by searching over a synthetic dataset that keeps the real cross-modality correlations and each modality’s cross-validated C-index. The weights can also vary by time bin (TD-RMSurv). Pathology reports were one of its modalities, embedded with GatorTron through HONeYBEE.
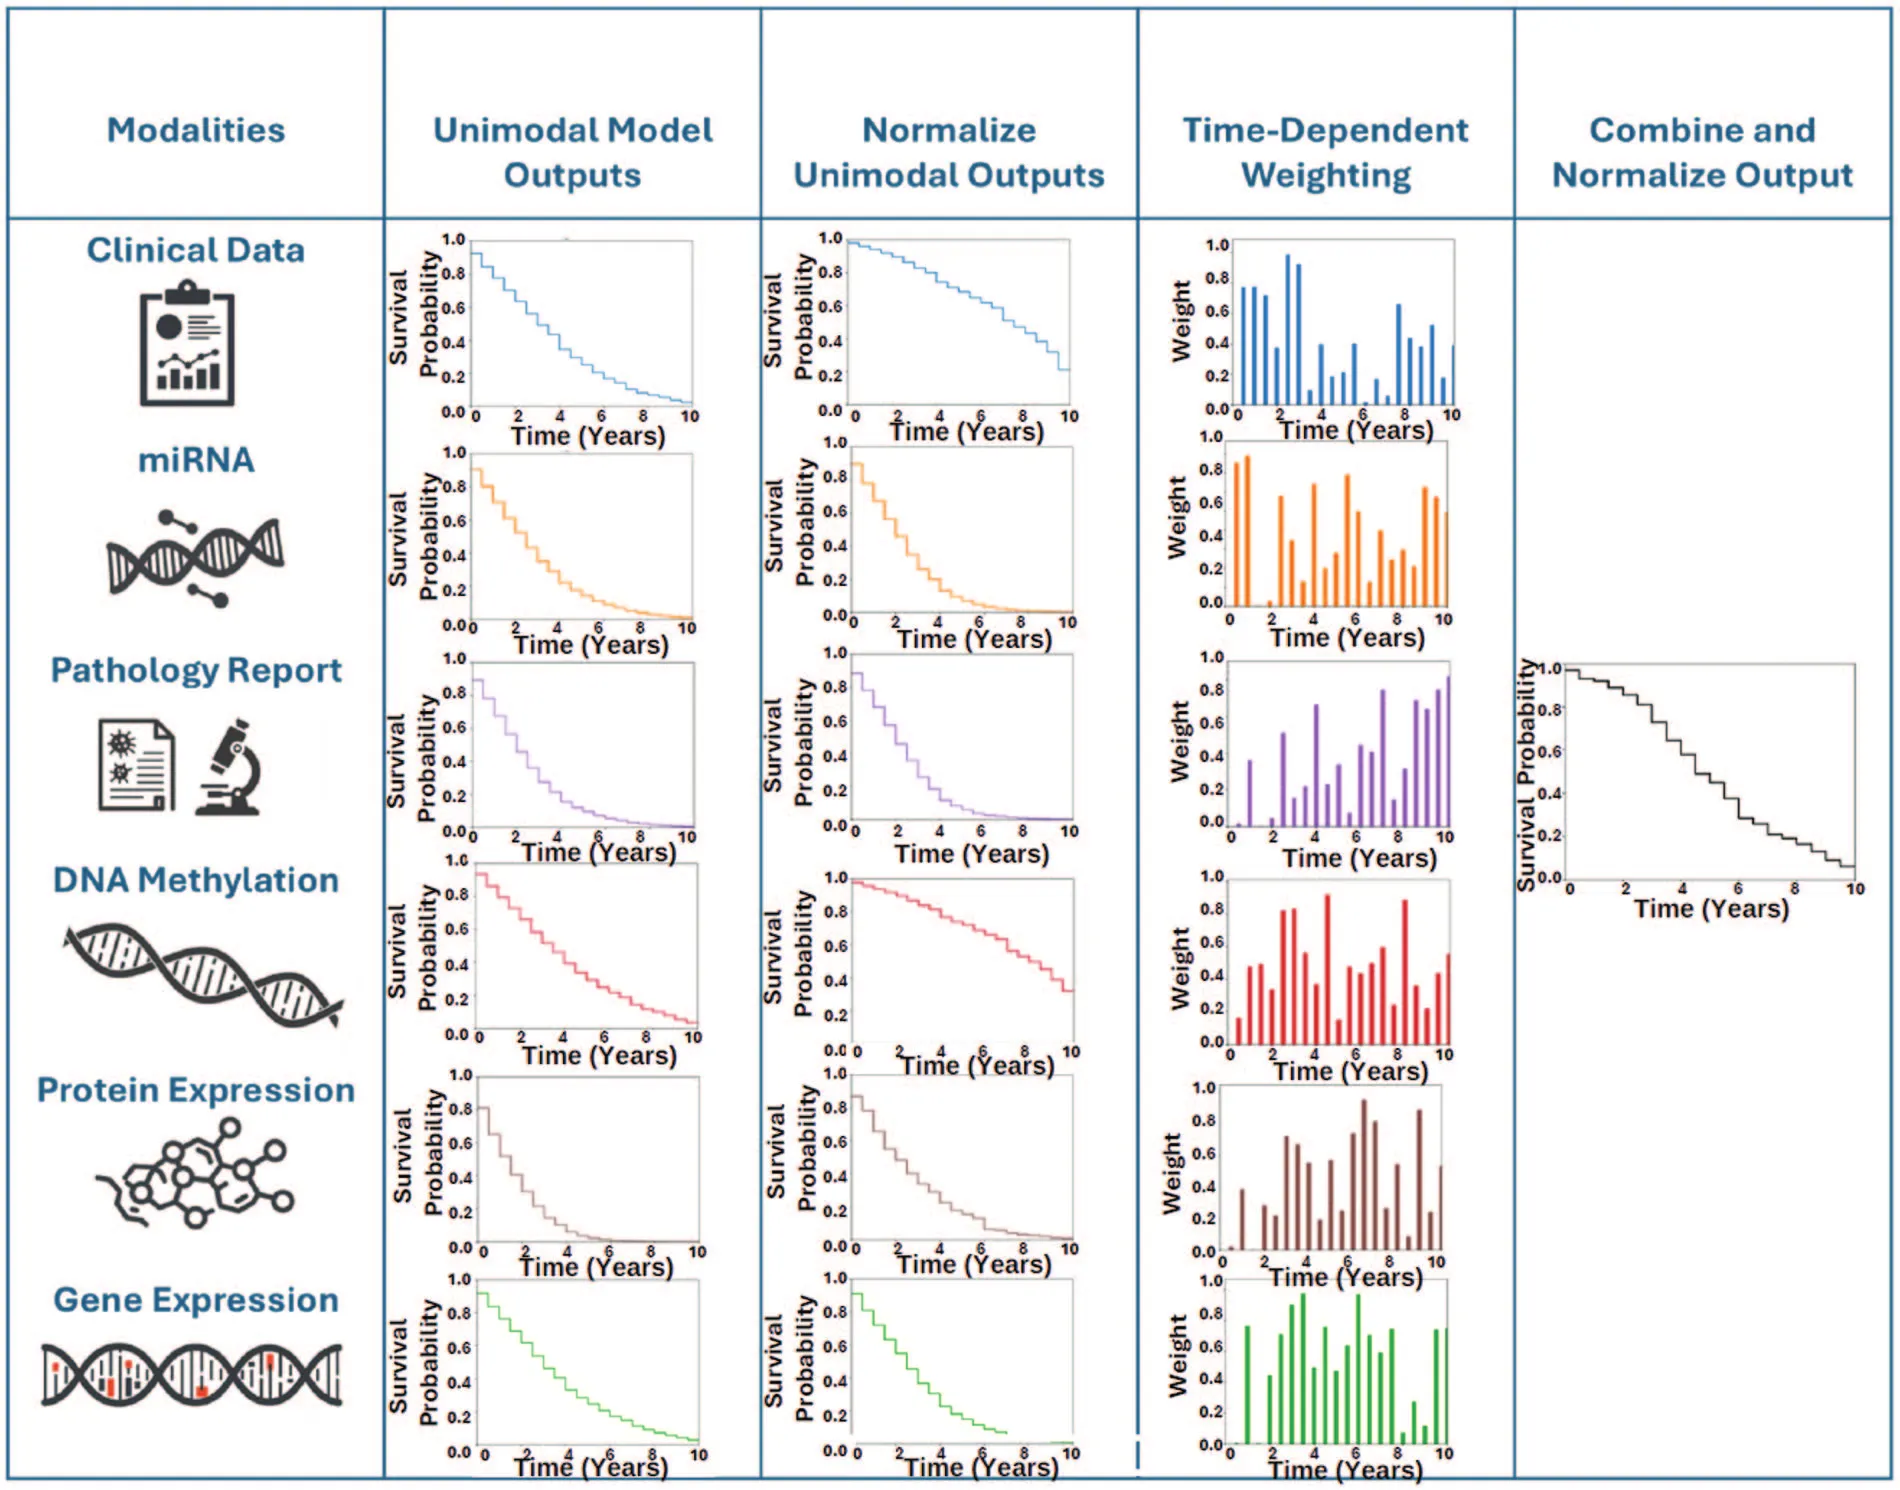
On the six-modality TCGA lung adenocarcinoma dataset, RMSurv improved on the best unimodal C-index by 0.0273, compared with 0.0143 for an existing late-fusion method and 0.0072 for early fusion. On the 11,060-case pan-cancer dataset, TD-RMSurv reached a cross-validated C-index of 0.7533 with six modalities. The learned weights are also interpretable: in one combined LUAD + LUSC fold, the model put 90% of the weight on clinical data in the first six-month bin and shifted weight to other modalities later. The code is public.8
PARADIGM. Asim Waqas led this project as first author, and I contributed. PARADIGM uses SeNMo as its omics encoder. It embeds each modality with a foundation model, builds a graph whose nodes are patients and trains a graph neural network for survival. In the pan-squamous preprint, SeNMo produces the 48-dimensional omics embedding, UNI encodes slides and GatorTron encodes clinical text and pathology reports. A graph convolutional network was trained on five TCGA squamous cell carcinomas with 7-fold cross-validation, and the framework was also evaluated on a 103-patient Moffitt lung SCC cohort.9 The AACR 2025 abstract extends the analysis to five adenocarcinomas and reports significant improvements over unimodal and multimodal MLP, Transformer and XGBoost models.10
Multimodal survival prediction from precomputed embeddings continues in EAGLE (Efficient Alignment of Generalized Latent Embeddings), which adds attention-based fusion and interpretable attribution analysis. SeNMo’s TCGA molecular embeddings are distributed alongside the HONeYBEE embedding resource.
Resources
- Paper: open access in the International Journal of Molecular Sciences.1
- Code: training, fine-tuning, testing and ensemble scripts at lab-rasool/SeNMo.11
- Weights: the ten pan-cancer checkpoints on Hugging Face and on Zenodo in two parts.12
- Embeddings: TCGA molecular embeddings in the
molecularconfiguration (senmosplit) of Lab-Rasool/TCGA. - Data curation: MINDS, used to build the TCGA cohorts.
References
-
Waqas A, Tripathi A, Ahmed S, Mukund A, Farooq H, Johnson JO, Stewart PA, Naeini M, Schabath MB, Rasool G. Self-Normalizing Multi-Omics Neural Network for Pan-Cancer Prognostication. Int J Mol Sci. 2025;26(15):7358. doi:10.3390/ijms26157358. Open access at PMC12347193. ↩ ↩2
-
Tripathi A, Waqas A, Venkatesan K, Yilmaz Y, Rasool G. Building Flexible, Scalable, and Machine Learning-Ready Multimodal Oncology Datasets. Sensors. 2024;24(5):1634. doi:10.3390/s24051634. Code: github.com/lab-rasool/MINDS. ↩
-
Klambauer G, Unterthiner T, Mayr A, Hochreiter S. Self-Normalizing Neural Networks. arXiv:1706.02515, 2017. arxiv.org/abs/1706.02515. ↩
-
Liu J, Lichtenberg T, Hoadley KA, et al. An Integrated TCGA Pan-Cancer Clinical Data Resource to Drive High-Quality Survival Outcome Analytics. Cell. 2018;173:400-416. doi:10.1016/j.cell.2018.02.052. ↩
-
Waqas A, Tripathi A, Ahmed S, Mukund A, Stewart P, Naeini M, Farooq H, Rasool G. SeNMo: A self-normalizing deep learning model for enhanced multi-omics data analysis in oncology. Cancer Res. 2024;84(6 Suppl):908. doi:10.1158/1538-7445.AM2024-908. ↩
-
Waqas A, Tripathi A, Ahmed S, et al. Self-Normalizing Foundation Model for Enhanced Multi-Omics Data Analysis in Oncology. arXiv:2405.08226, 2024. arxiv.org/abs/2405.08226. ↩
-
Flack D, Tripathi A, Waqas A, Rasool G, Dera D. Robust Multimodal Fusion for Survival Prediction in Cancer Patients. Cancer Inform. 2025;24:11769351251376192. doi:10.1177/11769351251376192. ↩
-
RMSurv source code: github.com/dom416/RMSurv. ↩
-
Waqas A, Tripathi A, Stewart P, Naeini M, Schabath MB, Rasool G. Embedding-based Multimodal Learning on Pan-Squamous Cell Carcinomas for Improved Survival Outcomes. arXiv:2406.08521, 2024. arxiv.org/abs/2406.08521. ↩
-
Waqas A, Tripathi A, Naeini M, Stewart PA, Schabath MB, Rasool G. PARADIGM: an embeddings-based multimodal learning framework with foundation models and graph neural networks [abstract]. Cancer Res. 2025;85(8 Suppl 1):991. doi:10.1158/1538-7445.AM2025-991. ↩
-
SeNMo source code: github.com/lab-rasool/SeNMo. ↩
-
SeNMo model checkpoints and sample embeddings, Part 1: doi:10.5281/zenodo.14219799; Part 2: doi:10.5281/zenodo.14286190. ↩
Cite the paper
Waqas A, Tripathi A, Ahmed S, Mukund A, Farooq H, Johnson JO, et al. Self-Normalizing Multi-Omics Neural Network for Pan-Cancer Prognostication. Int J Mol Sci. 2025;26(15):7358. doi:10.3390/ijms26157358
@article{waqas2025senmo,
  title   = {Self-Normalizing Multi-Omics Neural Network for Pan-Cancer Prognostication},
  author  = {Waqas, Asim and Tripathi, Aakash and Ahmed, Sabeen and Mukund, Ashwin and Farooq, Hamza and Johnson, Joseph O. and Stewart, Paul A. and Naeini, Mia and Schabath, Matthew B. and Rasool, Ghulam},
  journal = {International Journal of Molecular Sciences},
  year    = {2025},
  volume  = {26},
  number  = {15},
  pages   = {7358},
  doi     = {10.3390/ijms26157358}
}