Blog · Research · EAGLE · 8 min read
EAGLE: attention fusion and attribution for cancer survival
Fusing imaging, report and clinical embeddings with cross-modal attention, then asking which modality drove each patient's risk score.
Contents
The information that predicts how long a cancer patient will live is spread across several kinds of data: imaging studies, free-text radiology and pathology reports, and structured fields such as age, stage, smoking history and laboratory values. Clinicians read these together. Many survival models do not. They either use one source or concatenate features from several, which treats every source as equally important for every patient.
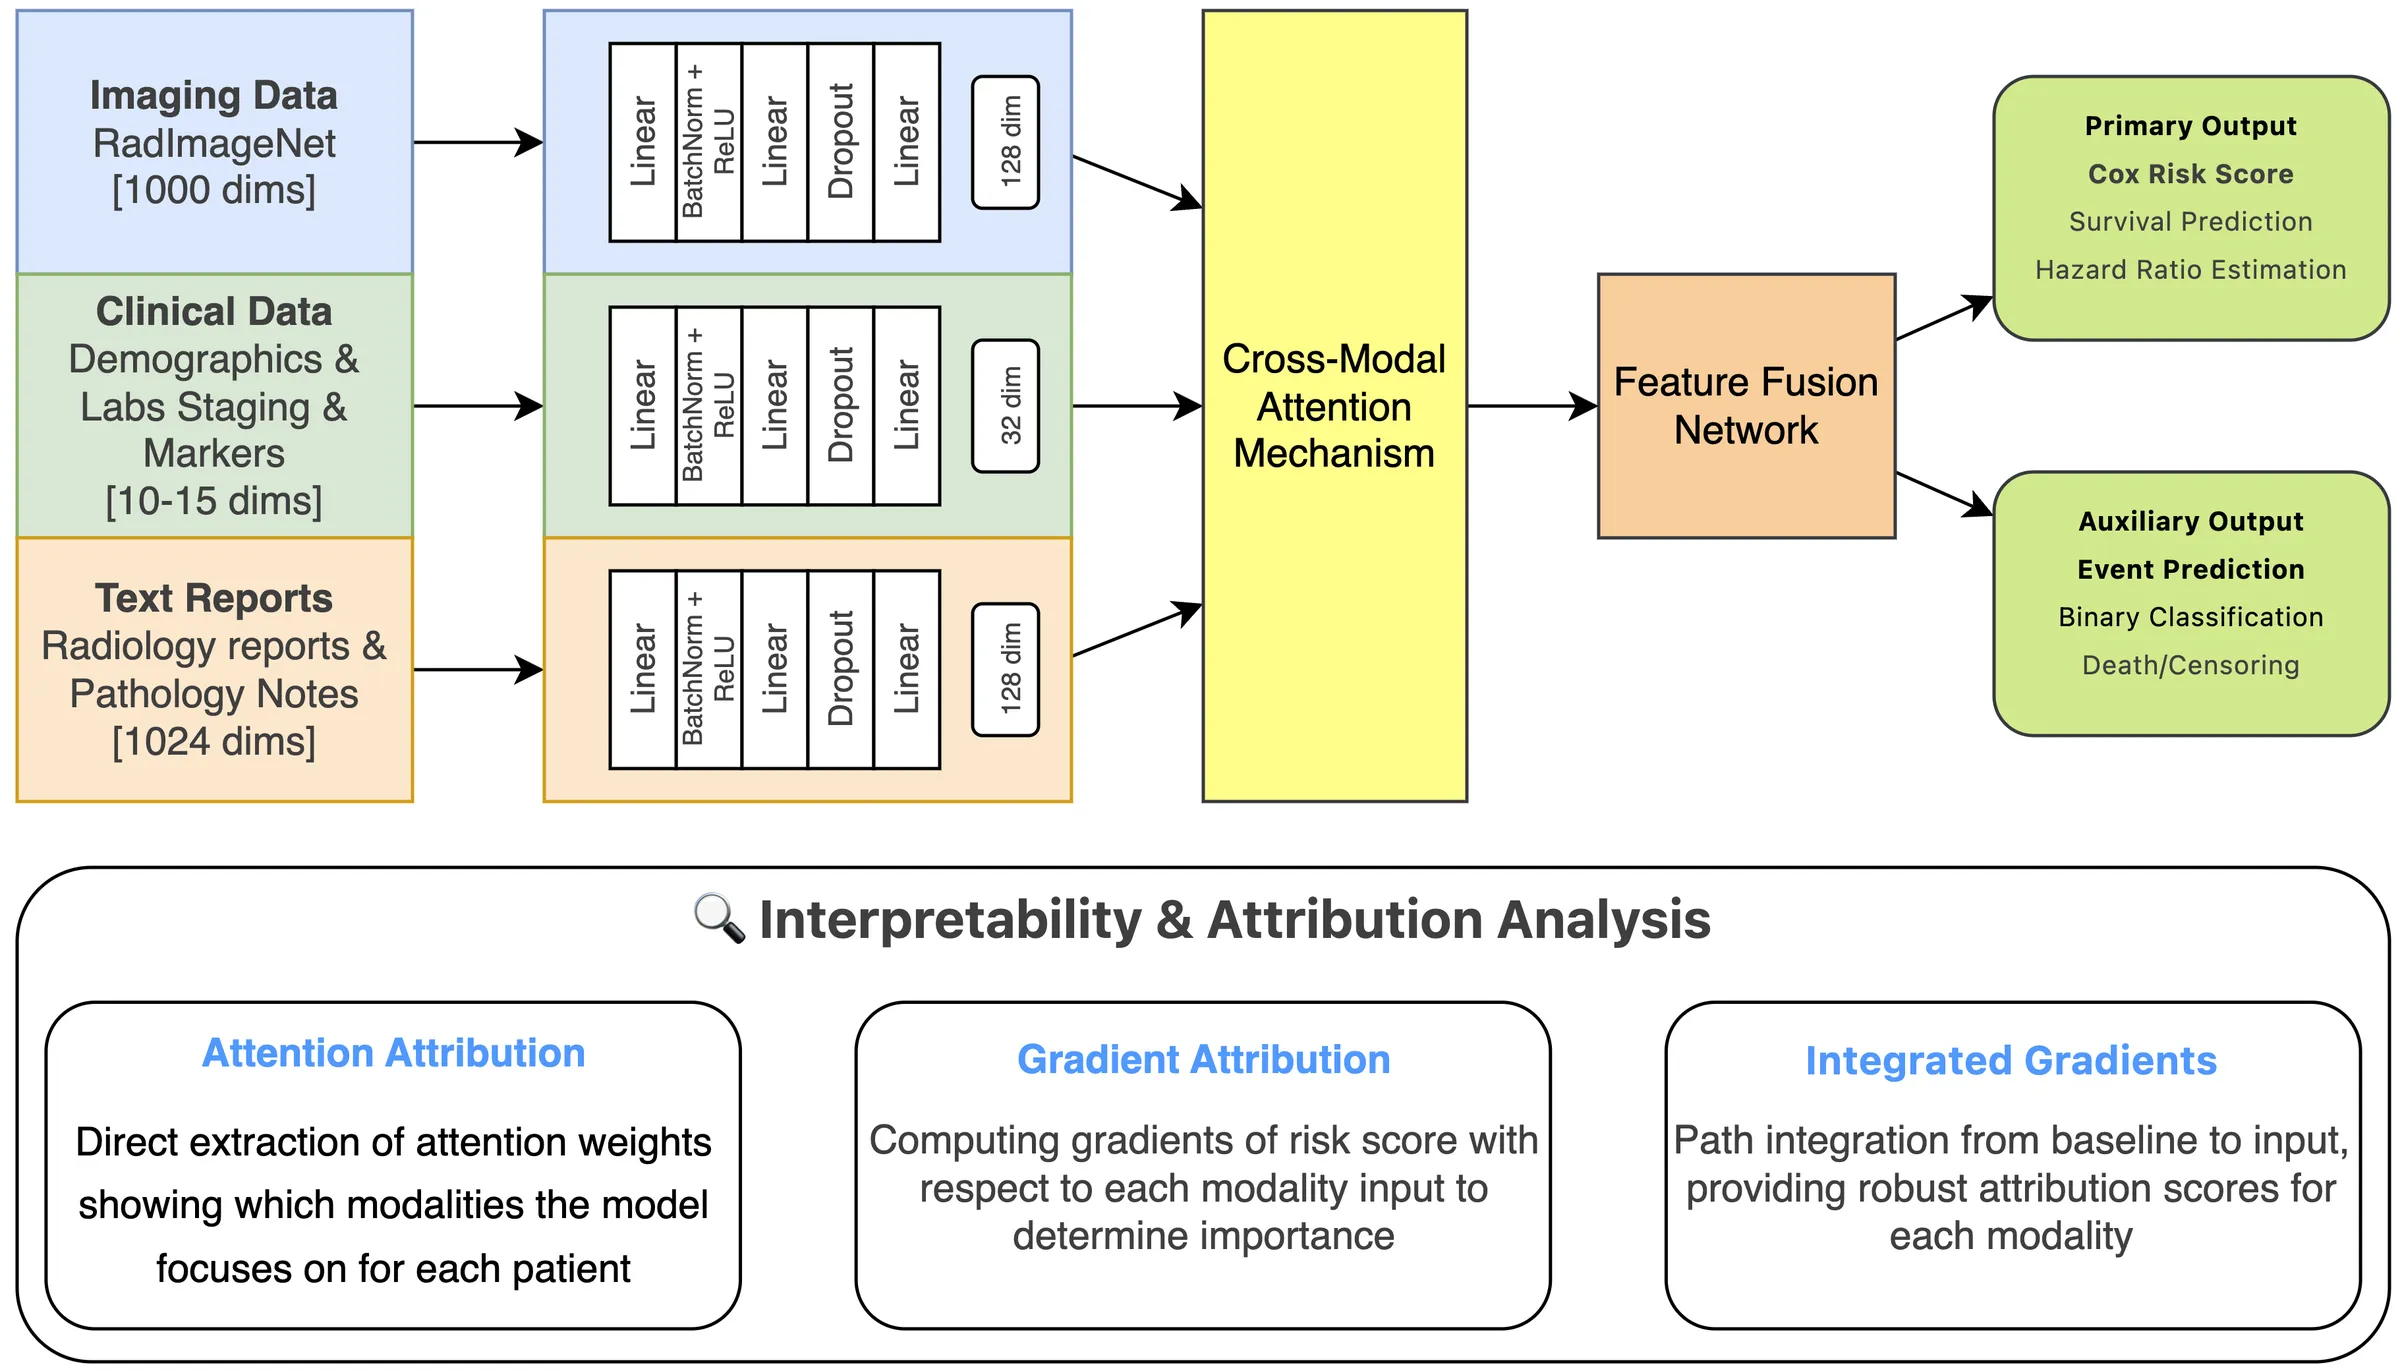
EAGLE (Efficient Alignment of Generalized Latent Embeddings) is our framework for survival prediction from imaging, text and clinical data together. It takes embeddings that have already been computed for each modality, compresses each one with a small encoder, applies cross-modal attention between modalities, and outputs a Cox risk score. For every patient it also reports how much each modality contributed to that score.1
We evaluated EAGLE on 911 patients across glioblastoma (GBM), intraductal papillary mucinous neoplasm (IPMN) and non-small cell lung cancer (NSCLC). From a 64-dimensional fused representation, it reached C-indices of 0.637, 0.679 and 0.598, and its risk tertiles separated patients with clearly different survival in every cohort. I am first author; Asim Waqas, Matthew B. Schabath, Yasin Yilmaz and Ghulam Rasool are co-authors.
In short
- Problem: survival signals are split across imaging, reports and clinical records, and simple fusion weights them all the same for every patient.
- What we built: EAGLE, which fuses precomputed embeddings with cross-modal attention into a 64-dimensional patient representation and a Cox risk score.
- Result: C-indices of 0.637 (GBM), 0.679 (IPMN) and 0.598 (NSCLC) across 911 patients, with risk tertiles that separate survival in each cohort.
- Explanation: three attribution methods give each modality’s share of every score. They can disagree, so they are best read together.
Why fusion is hard
Using a single modality leaves information out. An imaging-only model cannot see comorbidities or performance status. A clinical-only model misses tumor morphology. The two common fixes have their own problems. Concatenating features assumes every modality carries the same weight. Late fusion trains a separate model for each modality and combines their predictions, so it can miss interactions between modalities during training.
Real cohorts add two more problems: missing data, and outcomes that differ sharply from one cancer to the next. In our cohorts, pathological staging was missing for about 47% of NSCLC patients, non-contrast CT was available for 37.2% of them, and radiology reports existed for 78.9% of IPMN patients. The GBM cohort has a median survival of 13.0 months and a 95.6% event rate, against 6.53 years and 48.5% for IPMN. Clinicians also need to know why a model rates a patient as high risk before they will act on it, and a black-box fusion model cannot tell them.
How it works
EAGLE runs in a fixed sequence of stages. Embeddings are extracted once, before training, so only the encoders, attention and fusion layers, and prediction heads are trained.
Modality encoders
Each modality enters as a fixed embedding. Imaging embeddings come from RadImageNet2. They have 1,000 dimensions for GBM MRI and IPMN CT and 2,048 for NSCLC, where the contrast and non-contrast CT embeddings are concatenated. Reports are embedded with GatorTron3, a clinical language model. For GBM and IPMN several report types are concatenated, giving 2,304 and 1,536 dimensions. NSCLC uses a single 1,024-dimensional clinical text embedding. Structured data contribute 10-36 clinical features. Numeric values are median-imputed and z-scored. Categorical values are label-encoded, with an explicit “Unknown” category for missing entries. Dataset-specific extractors also pull binary flags out of the report text, such as MGMT methylation in GBM and main-duct involvement in IPMN.
Each encoder is a stack of linear layers, each followed by batch normalization, ReLU and dropout (p = 0.3 by default). Imaging and text are compressed to 128 dimensions. The default stack is [512, 256, 128], with [256, 128] for some cohorts. Clinical features are compressed to 32 dimensions through [64, 32], or [128, 64, 32] for NSCLC.
Cross-modal attention
After encoding, the modality representations are projected to a common dimension and arranged as a short sequence. Multi-head attention (8 heads, dropout 0.1) is then applied to two pairs: imaging and text, and imaging and clinical. Imaging appears in both pairs. The attended features are pooled, concatenated and passed through a fusion network ([256, 128, 64] by default) that ends in a 64-dimensional patient representation. The model keeps the attention weights from each forward pass so they can be used for attribution later.
Survival objective
The primary head outputs one risk score per patient and is trained with the Cox partial likelihood, which handles censored follow-up. The paper writes the risk score as . With the event indicator and the set of patients still at risk at time :
An auxiliary binary head predicts whether the event occurs. It is trained jointly with the Cox head, and its loss is weighted by .
Three attribution methods
EAGLE estimates each modality’s share of a prediction in three ways. Simple attribution is the share of activation magnitude in each encoded representation :
Gradient-based attribution uses gradient × activation. Integrated gradients accumulates gradients along a path from a zero-embedding baseline to the actual input. All three are normalized to percentages, which gives a modality breakdown for each patient and for the whole cohort. Patients are then split into low, medium and high risk using tertiles of the predicted score.
Data and evaluation
The paper describes the cohorts as clinically representative but drawn from single institutions. The AACR 2026 abstract places all 911 patients at a single NCI-designated cancer center.
| Cohort | Patients | Imaging | Text | Median survival | Event rate |
|---|---|---|---|---|---|
| GBM | 160 | MRI (T1 ± contrast, T2, FLAIR), 1,000-d | Radiology (100%), pathology (96.2%), treatment summaries; 2,304-d | 13.0 months | 95.6% |
| IPMN | 171 | Triple-phase CT (87.1% available), 1,000-d | Radiology (78.9%), pathology (98.2%); 1,536-d | 6.53 years | 48.5% |
| NSCLC | 580 | Contrast CT (74.0%) + non-contrast CT (37.2%), 2,048-d | Clinical embeddings of radiology and clinical documentation, 1,024-d | 35.0 months | 51.7% |
We trained with 5-fold cross-validation, stratified by event status. We report the C-index, log-rank tests between risk groups and Kaplan-Meier curves. For baselines, we ran Random Survival Forests (RSF), Cox proportional hazards (CoxPH) and DeepSurv4 on unimodal embeddings and on MedGemma multimodal embeddings.
Training configuration
- Optimizer: AdamW, learning rate 1e-4 (GBM, IPMN) or 5e-5 (NSCLC), weight decay 0.01
- Scheduler: ReduceLROnPlateau on validation C-index; early stopping with patience 15
- Gradient clipping at norm 1.0; batch size 32 (GBM, IPMN) or 24 (NSCLC)
- Dropout 0.3 by default, 0.35 for NSCLC
- Implemented in PyTorch with fixed random seeds
Results
- patients in three cohorts
- 911
- modalities: imaging, text, clinical
- 3
- dimensions in the fused representation
- 64
- attribution methods
- 3
EAGLE reached a C-index of 0.637 ± 0.087 on GBM, 0.679 ± 0.029 on IPMN and 0.598 ± 0.021 on NSCLC. Against the best baseline on unimodal or MedGemma inputs, EAGLE scored higher on GBM (0.637 vs 0.589) and IPMN (0.679 vs 0.585) and lower on NSCLC (0.598 vs 0.640).
- EAGLE
- Best baseline, unimodal or MedGemma input
Concordance index (0.5 = random ranking)
Risk groups
The tertile risk groups separate clearly in all three cohorts. In GBM the differences are significant (log-rank p < 0.001). In IPMN the low-risk group had minimal events over extended follow-up: 3 events among 56 patients.
Which modality mattered
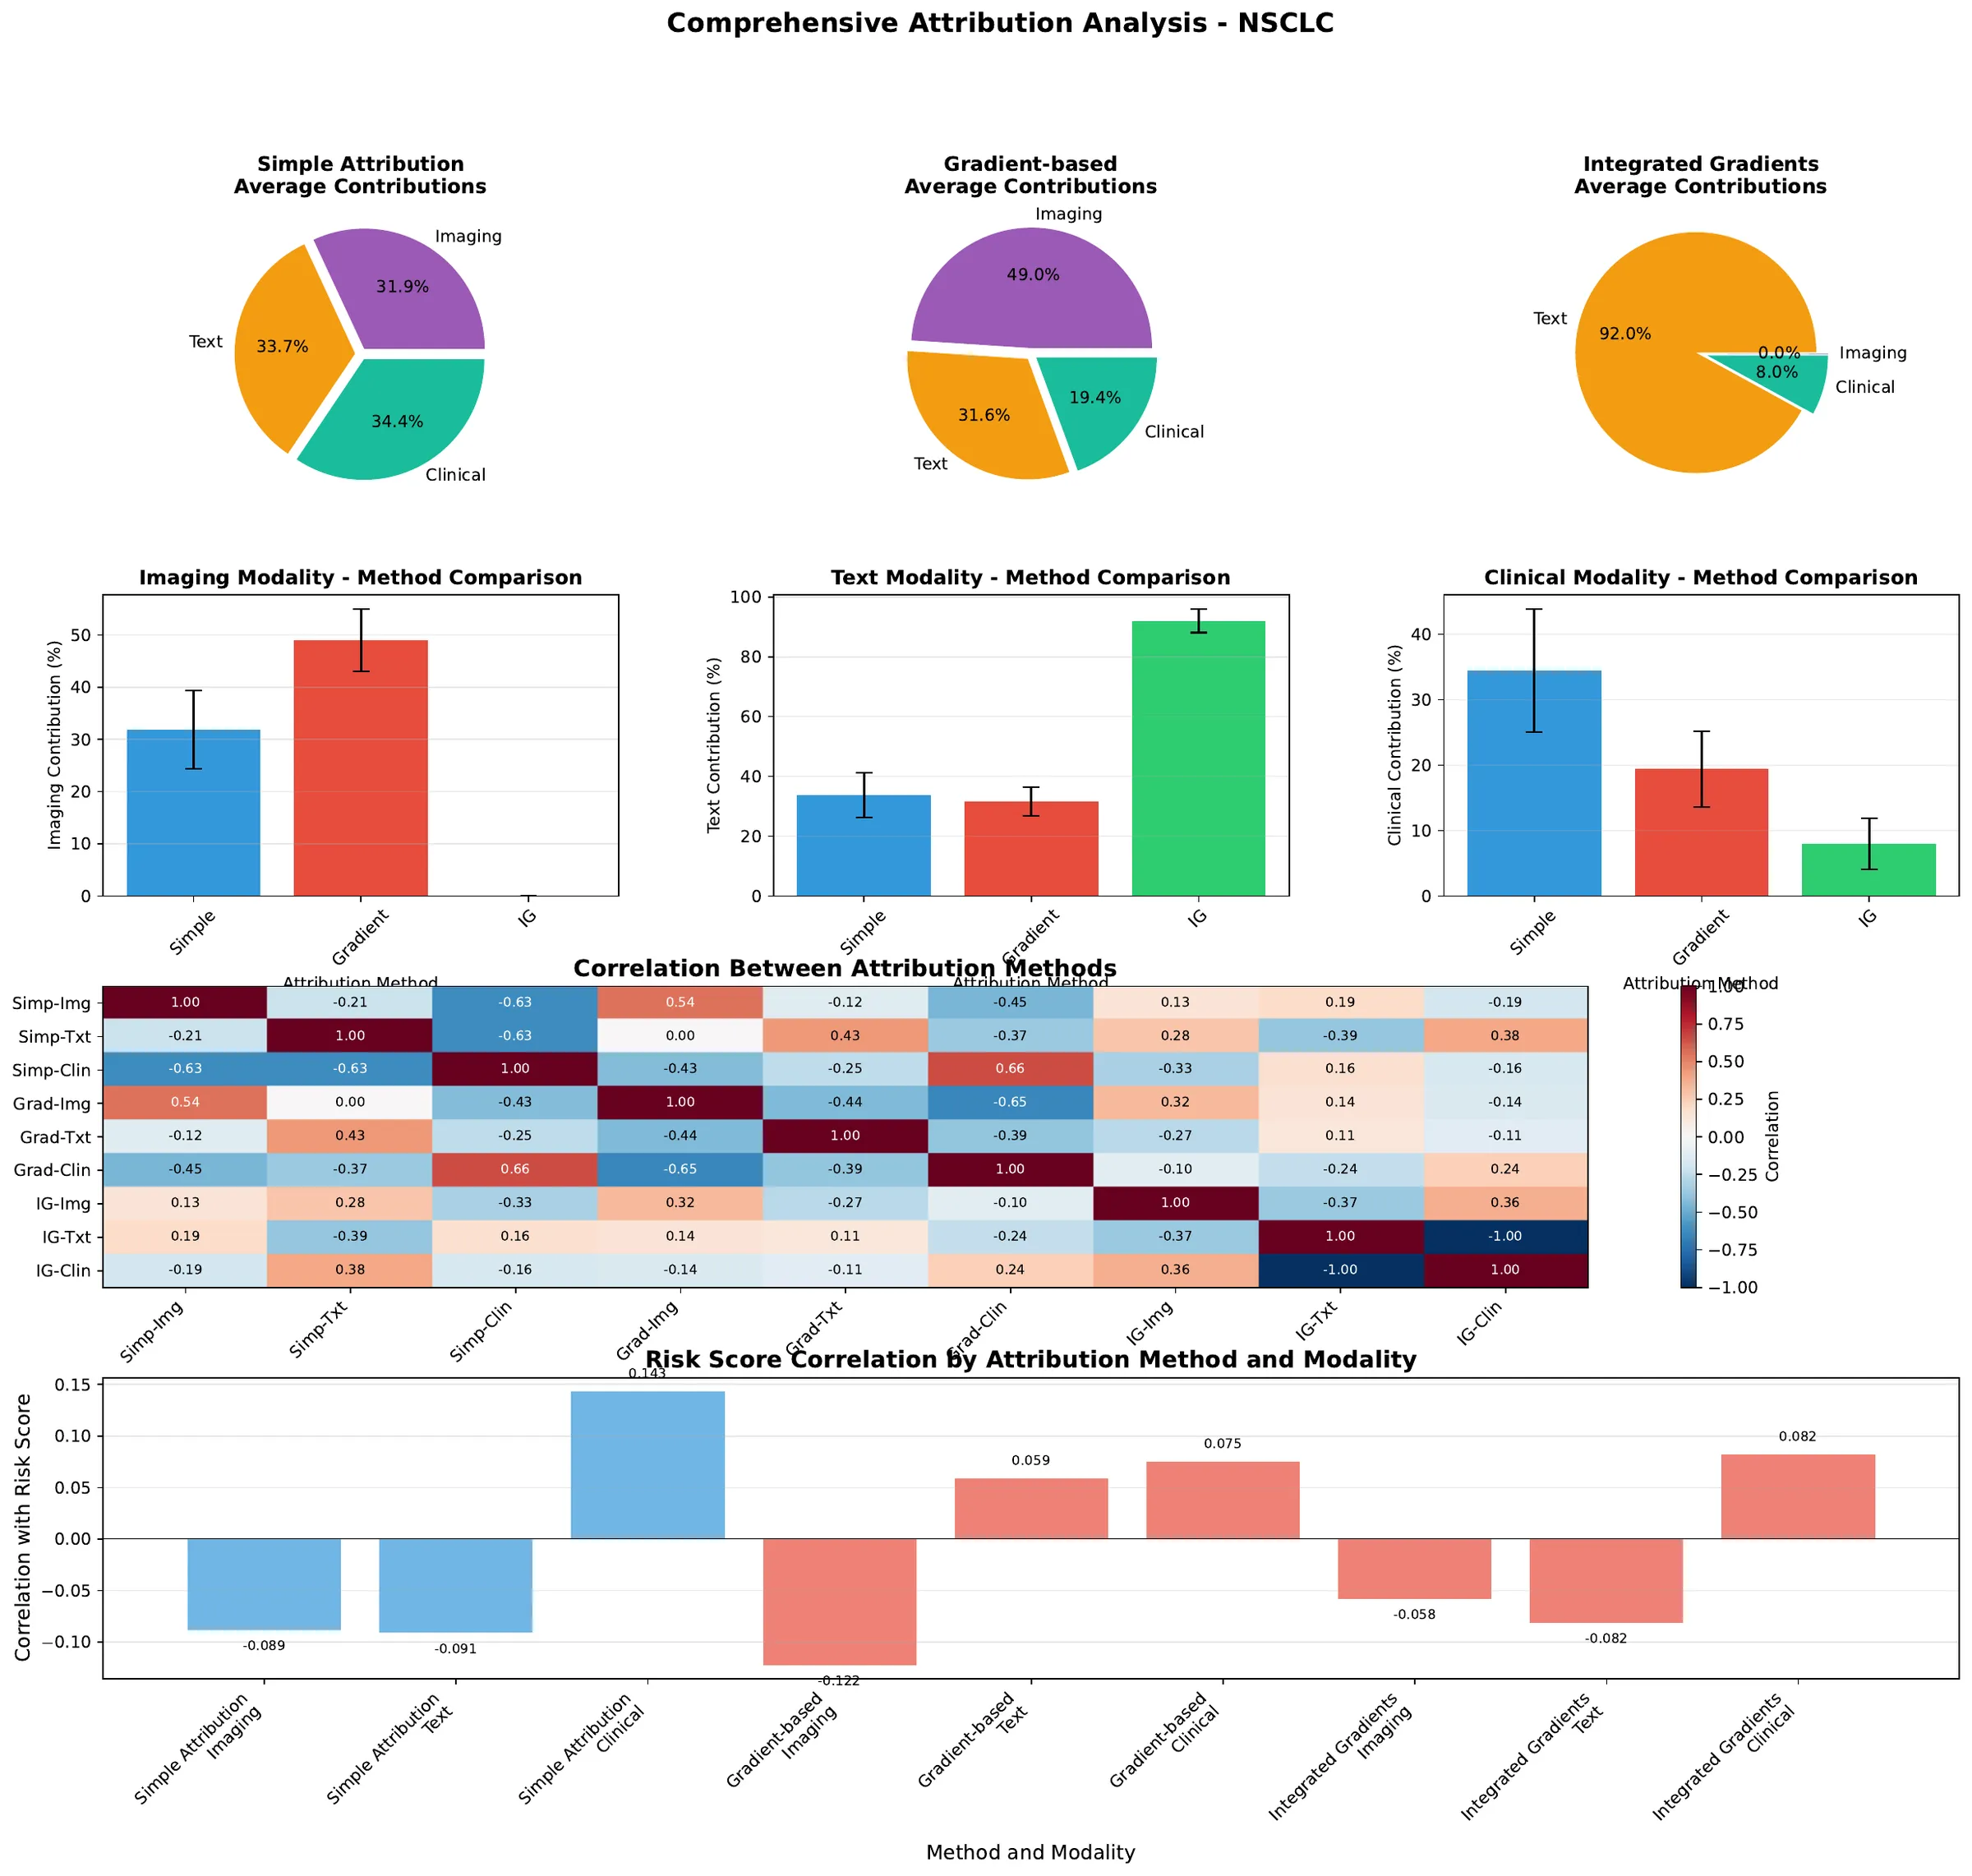
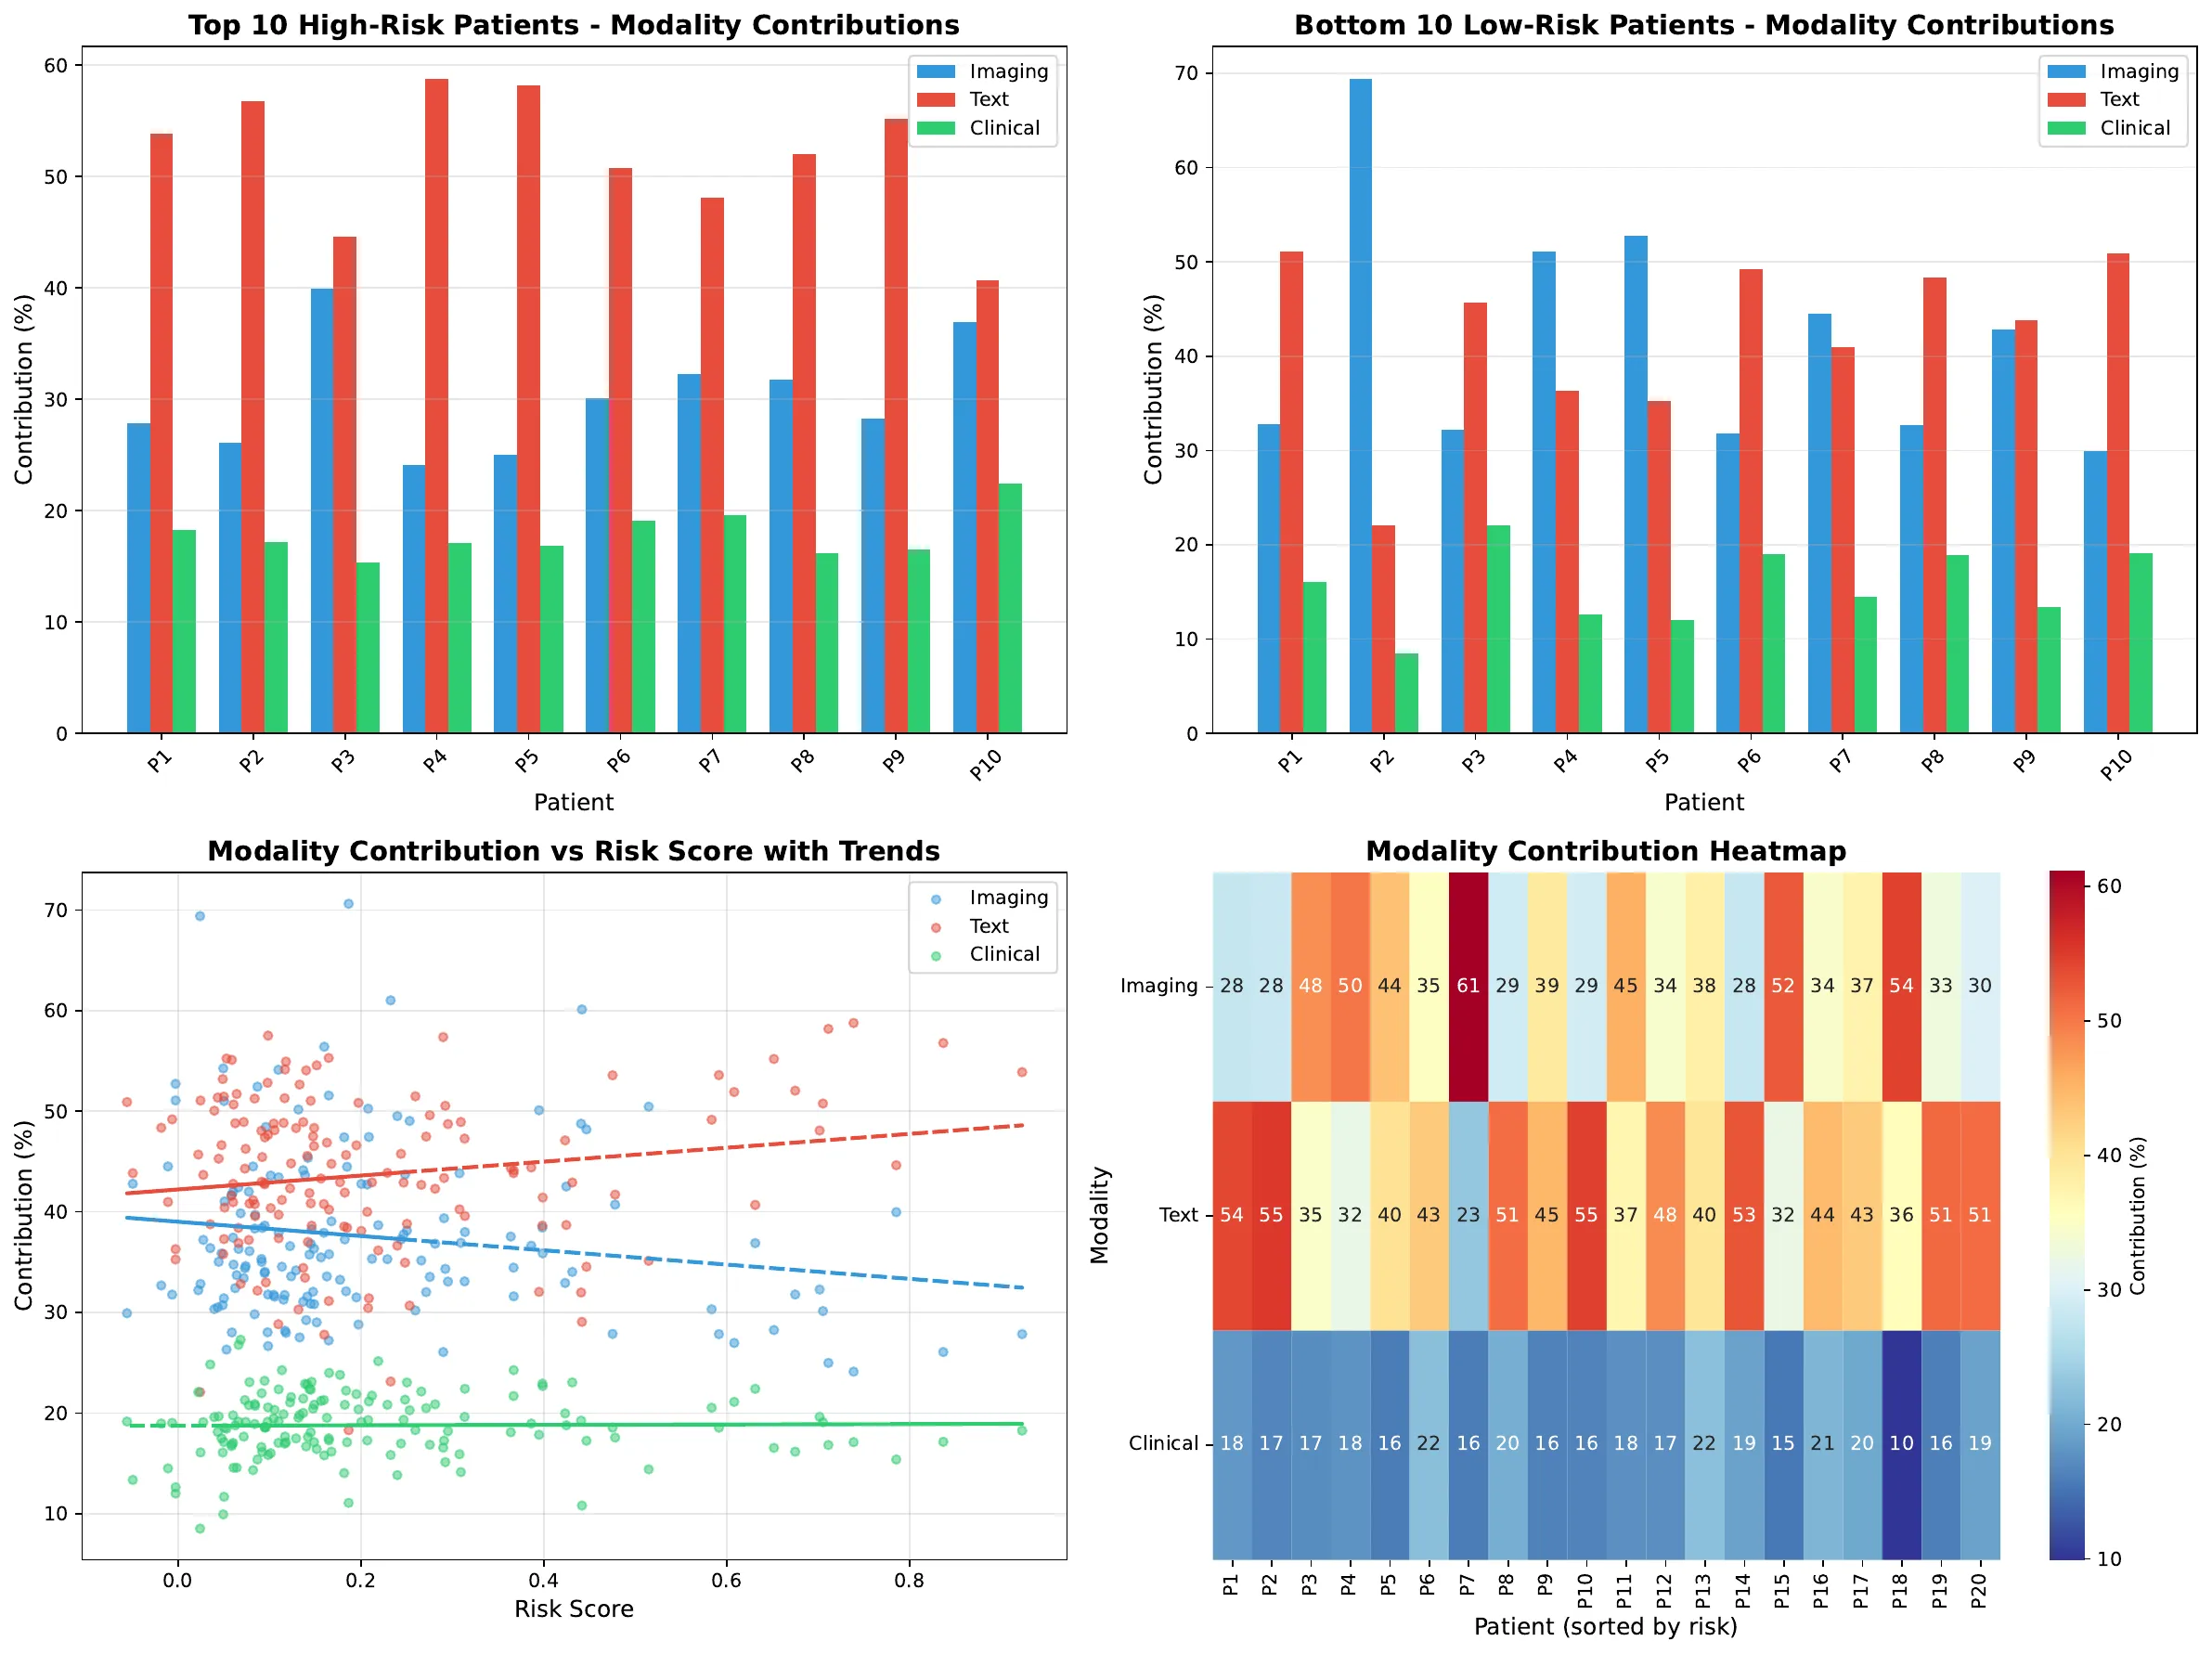
The answer depends on the attribution method as much as on the disease. Under simple attribution, text reports carried the most weight in GBM, while IPMN and NSCLC split almost evenly across the three modalities. Gradient-based attribution ranks imaging first in all three cohorts, and in NSCLC it gives imaging 49.0%, text 31.6% and clinical data 19.4%.
Reading the attributions
The paper reads the attribution patterns against clinical understanding of each disease. In GBM, it suggests the weight on text reflects surgical and pathological details that are often written only in narrative reports: extent of resection, MGMT methylation and IDH mutation status. In IPMN, the even split fits guidelines that call for combined review of imaging features, cyst fluid analysis and clinical presentation. In NSCLC, it ties the 49.0% gradient-based imaging share to the central role of CT in TNM staging.
Limitations
Most of these limitations are stated in the preprint itself.
- Baselines sometimes win. On NSCLC, RSF on MedGemma embeddings beat EAGLE. The paper takes this as room for architectural refinement.
- Fixed embeddings. The image features are not learned end to end, which may limit what features the model can discover.
- Single-institution cohorts. External validation is needed before claiming the results generalize.
- One architecture for every cancer. The cohorts’ survival and event-rate profiles differ widely, and the paper suggests cancer-specific adaptations may work better than one shared design.
- Noisy attribution signals. Gradients with respect to pre-extracted embeddings can be very small. The paper computes all three methods for this reason, and as shown above, they can disagree.
- Wide spread on GBM. The GBM C-index has the largest reported spread (± 0.087), so it is the least certain of the three.
Next steps and related work
The paper lists the next steps: longitudinal data that capture treatment-response dynamics, more modalities (genomic profiles, liquid biopsies and digital pathology), uncertainty estimates for individual predictions, and prospective validation.
A related AACR 2025 abstract from our group used MINDS and HONeYBEE to curate data from over 10,000 cancer patients, combined modality embeddings with late fusion, and reported a 12% improvement in concordance indices over unimodal approaches.5 EAGLE instead learns cross-modal attention before fusion. An AACR 2026 abstract presents the same three cohorts (911 patients) and C-indices as a real-world evaluation, with HONeYBEE generating the embeddings from incomplete, heterogeneous routine-care data (8.2-47% missing). It adds risk-group medians for the 171-patient pancreatic cohort: 100 months (low risk) against 35 months (high risk).6
Resources
The code is public at lab-rasool/EAGLE.7 The patient data are not included. The scripts expect per-cohort Parquet embedding files under data/<cohort>/. The commands below follow the repository’s main.py:
git clone https://github.com/lab-rasool/EAGLE.git
cd EAGLE
pip install -r requirements.txt

# Train EAGLE on GBM, IPMN and NSCLC with all three attribution methods
python main.py --mode train --comprehensive-attribution

# Run the RSF, CoxPH and DeepSurv baselines
python main.py --mode baseline
For background on fusion strategies in oncology, see our review of multimodal data integration.8
References
-
Tripathi A, Waqas A, Schabath MB, Yilmaz Y, Rasool G. EAGLE: Efficient Alignment of Generalized Latent Embeddings for Multimodal Survival Prediction with Interpretable Attribution Analysis. arXiv:2506.22446, 2025. https://arxiv.org/abs/2506.22446 ↩
-
Mei X, Liu Z, Robson PM, et al. RadImageNet: An Open Radiologic Deep Learning Research Dataset for Effective Transfer Learning. Radiology: Artificial Intelligence. 2022;4(5):e210315. https://doi.org/10.1148/ryai.210315 ↩
-
Yang X, Chen A, PourNejatian N, et al. A large language model for electronic health records. npj Digital Medicine. 2022;5:194. https://doi.org/10.1038/s41746-022-00742-2 ↩
-
Katzman JL, Shaham U, Cloninger A, et al. DeepSurv: personalized treatment recommender system using a Cox proportional hazards deep neural network. BMC Medical Research Methodology. 2018;18:24. https://doi.org/10.1186/s12874-018-0482-1 ↩
-
Tripathi AG, Waqas A, Yilmaz Y, Schabath MB, Rasool G. Predicting treatment outcomes using cross-modality correlations in multimodal oncology data [abstract]. Cancer Research. 2025;85(8 Suppl 1):3641. https://doi.org/10.1158/1538-7445.AM2025-3641 ↩
-
Tripathi AG, Waqas A, Davis EW, Permuth JB, Farinhas J, Yilmaz Y, Schabath MB, Rasool G. Real-world evaluation of multimodal AI: Foundation model-driven multimodal AI for GBM, NSCLC, and PDAC [abstract]. Cancer Research. 2026;86(7 Suppl):1251. https://doi.org/10.1158/1538-7445.AM2026-1251 ↩
-
EAGLE source code, Rasool Lab. https://github.com/lab-rasool/EAGLE ↩
-
Waqas A, Tripathi A, Ramachandran RP, Stewart PA, Rasool G. Multimodal data integration for oncology in the era of deep neural networks: a review. Frontiers in Artificial Intelligence. 2024;7:1408843. https://doi.org/10.3389/frai.2024.1408843 ↩
Cite the paper
Tripathi A, Waqas A, Schabath MB, Yilmaz Y, Rasool G. EAGLE: Efficient Alignment of Generalized Latent Embeddings for Multimodal Survival Prediction with Interpretable Attribution Analysis. arXiv [Preprint]. 2025 Jun 12. arXiv:2506.22446. doi:10.48550/arXiv.2506.22446
@misc{tripathi2025eagle,
  title         = {{EAGLE}: Efficient Alignment of Generalized Latent Embeddings for Multimodal Survival Prediction with Interpretable Attribution Analysis},
  author        = {Tripathi, Aakash and Waqas, Asim and Schabath, Matthew B. and Yilmaz, Yasin and Rasool, Ghulam},
  year          = {2025},
  eprint        = {2506.22446},
  archivePrefix = {arXiv},
  primaryClass  = {cs.LG},
  doi           = {10.48550/arXiv.2506.22446},
  url           = {https://arxiv.org/abs/2506.22446}
}