Blog · Research · HONeYBEE · 10 min read
HONeYBEE: foundation model embeddings for multimodal oncology data
A publicly released framework that turns clinical text, slides, radiology and omics into patient embeddings, evaluated on 11,428 TCGA patients.
Contents
A cancer patient’s record is spread across very different kinds of data: structured fields and free-text notes in the health record, pathology and radiology reports, gigapixel whole-slide images (WSIs), CT, MRI and PET volumes, and molecular profiles. Foundation models now exist for most of these modalities, but each one usually runs in its own pipeline, with its own file formats and code. Combining them for one patient-level analysis is mostly plumbing, rebuilt from project to project.
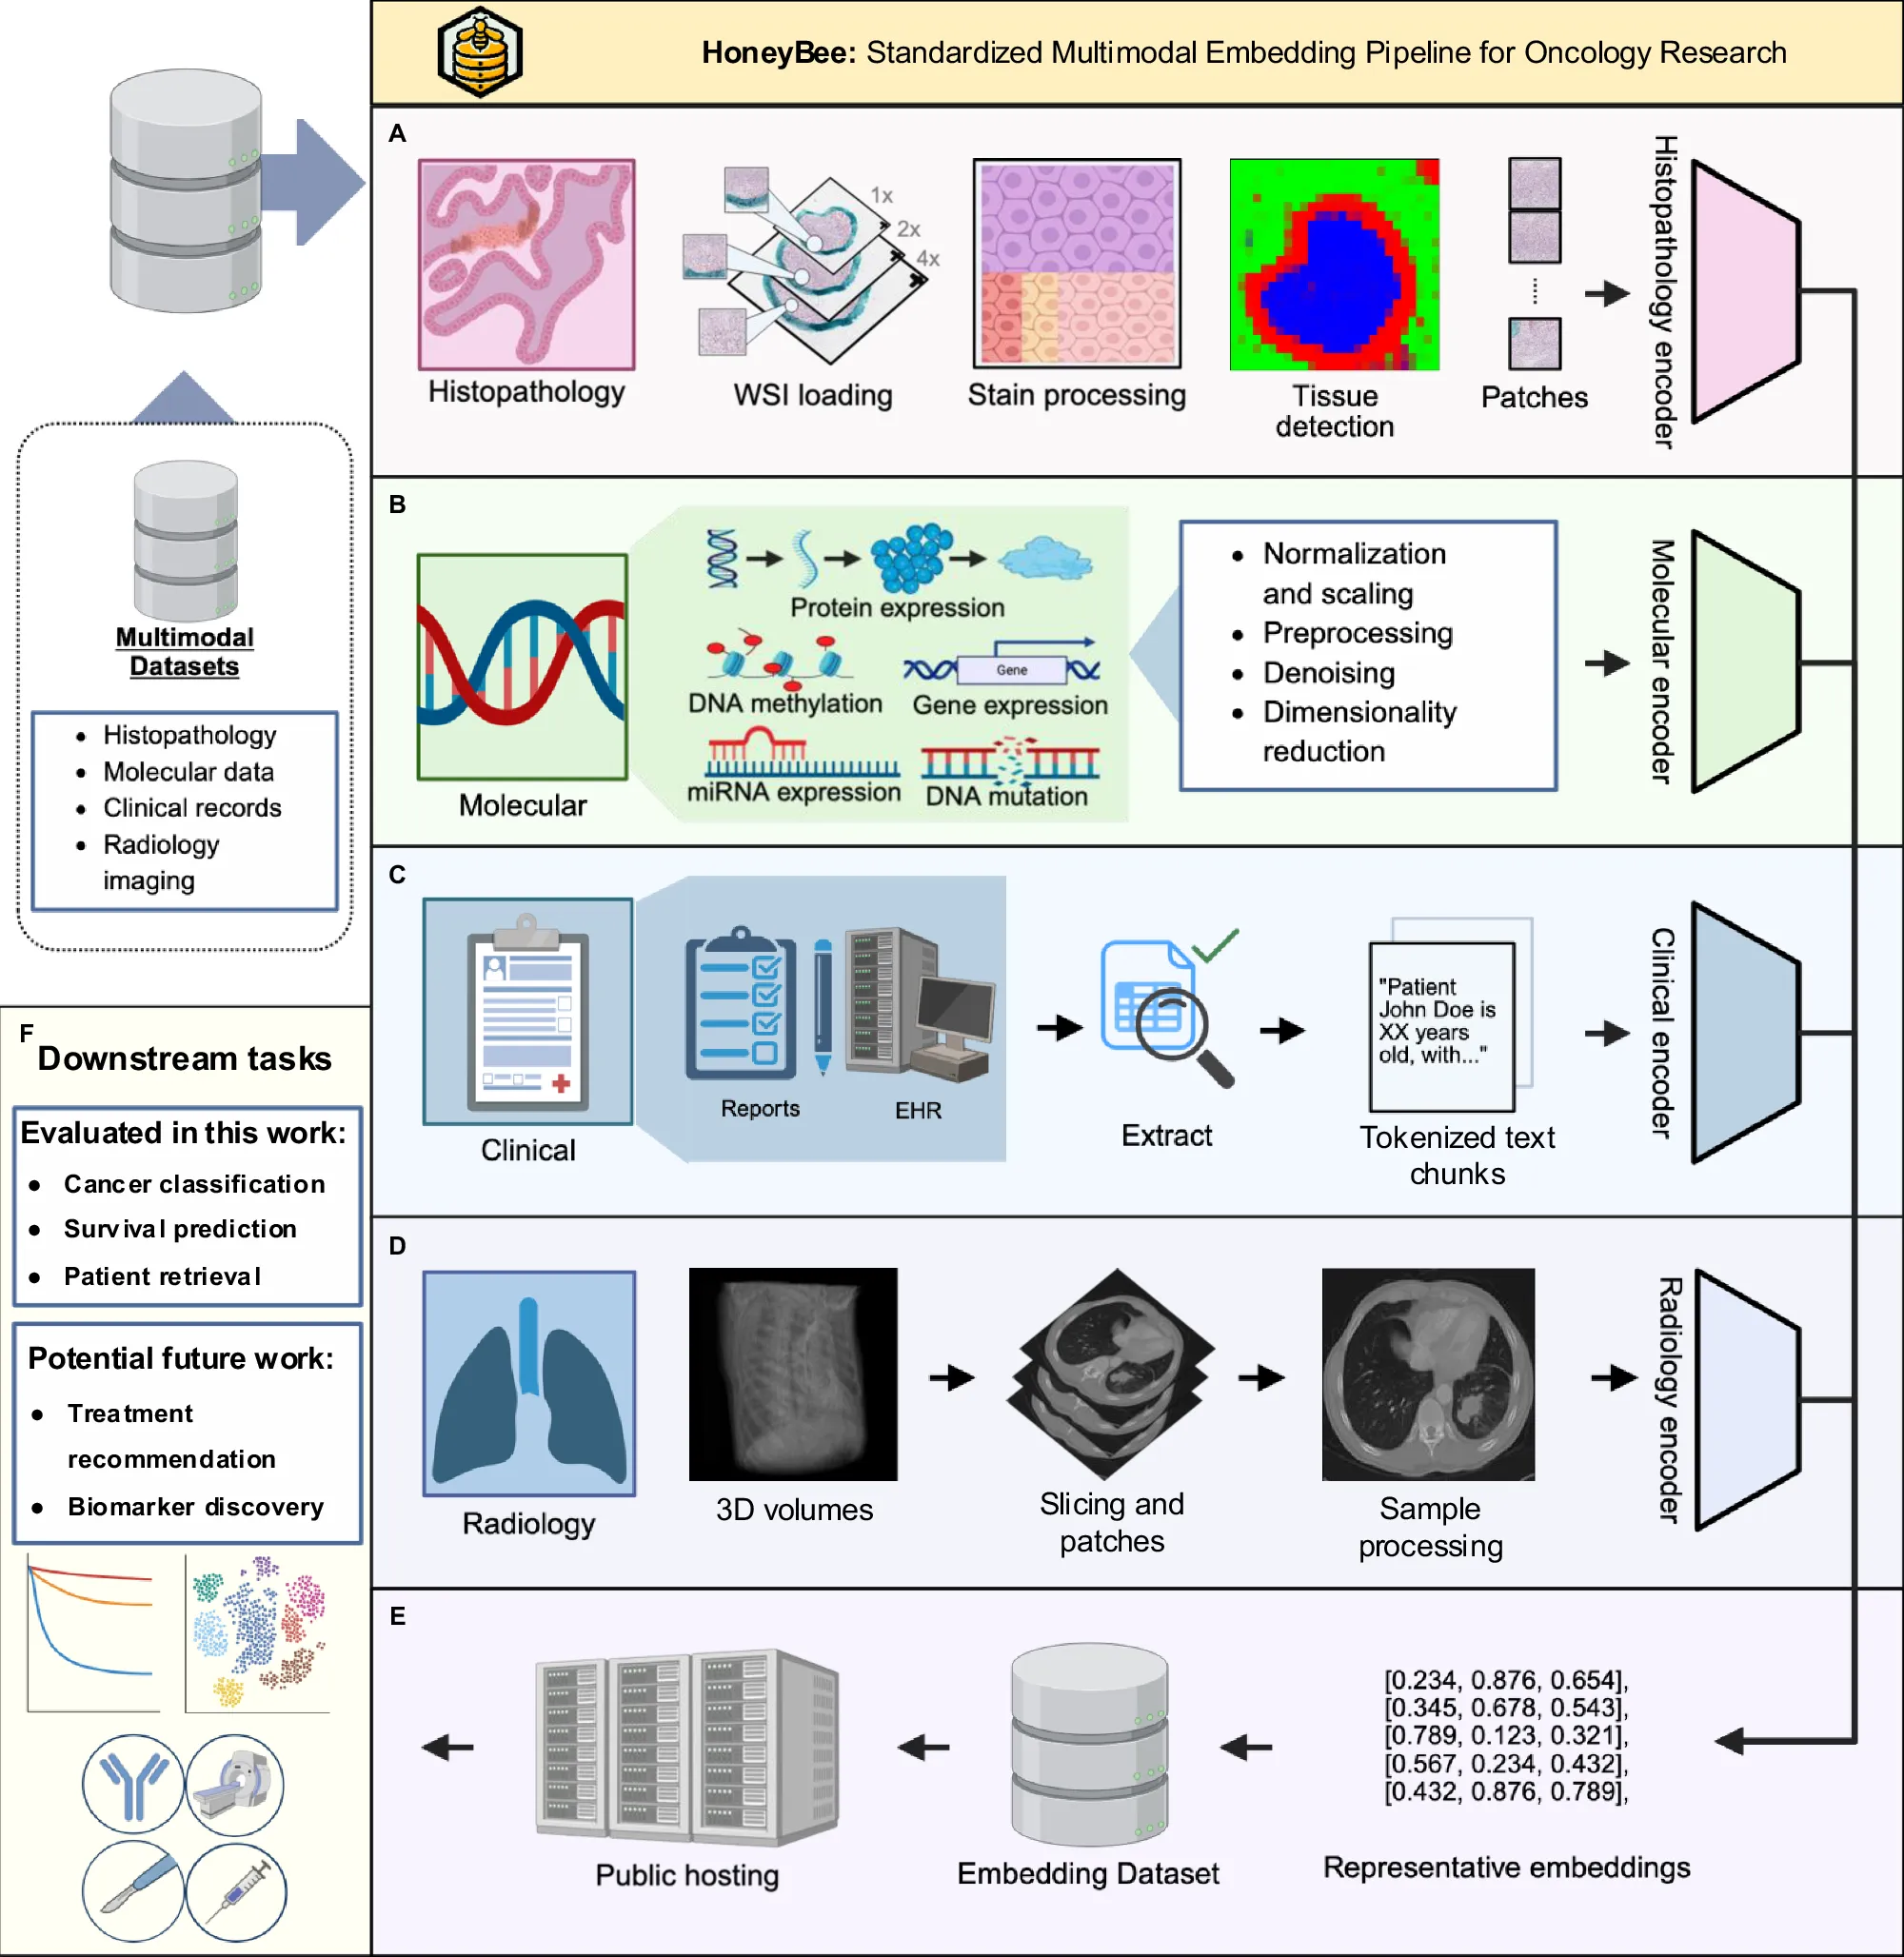
HONeYBEE (Harmonized ONcologY Biomedical Embedding Encoder) is our attempt to make that plumbing reusable. The open-source framework preprocesses each modality, runs a domain-specific foundation model to turn it into an embedding (a fixed-length vector of numbers), and fuses the per-modality embeddings into one patient-level representation for classification, retrieval, clustering and survival analysis.1
In short
- Problem: oncology data types are processed in separate pipelines, so combining them for one patient is slow, one-off work.
- What we built: an open-source framework that turns clinical text, pathology reports, slides, radiology and molecular data into embeddings, and releases the TCGA embeddings publicly.
- Headline result: on 11,428 TCGA patients across 33 cancer types, clinical-text embeddings reached 98.54% cancer-type accuracy and 0.964 precision@10 in patient retrieval.
- Fusion: combining modalities helped survival prediction for some cancer types, but hurt retrieval.
Why the data stays siloed
Oncology data is abundant but fragmented. Structured variables, clinical narratives, images and molecular profiles are usually processed separately, and foundation models are typically applied in one- or two-modality workflows, so complementary information goes unused.
The engineering problem is just as real. Multimodal projects stitch together separate tools (OHDSI for structured clinical data, PyDicom for radiology, OpenSlide and TIAToolbox for pathology), each with its own API and metadata conventions. Missing data makes it harder: coverage varies from patient to patient, and keeping only complete cases discards much of the cohort.
Our hypothesis was that fusing embeddings from several modalities yields richer patient representations, particularly where clinical documentation is incomplete or less structured.
What HONeYBEE does
HONeYBEE handles five data types: structured and unstructured clinical data, pathology reports, WSIs, radiology images and molecular profiles. Each goes through its own pipeline and ends as an embedding; the embeddings are then fused and stored in a format that standard ML tooling can read directly. The framework works with PyTorch, Hugging Face and FAISS, and any foundation model with weights on Hugging Face can be swapped in for a given modality.
Raw data for the TCGA study was pulled with MINDS, our earlier framework for building machine-learning-ready multimodal oncology datasets.3 The generated embeddings are public on Hugging Face, so downstream experiments can start from the embeddings rather than from raw data.4
How it works
Clinical text and reports
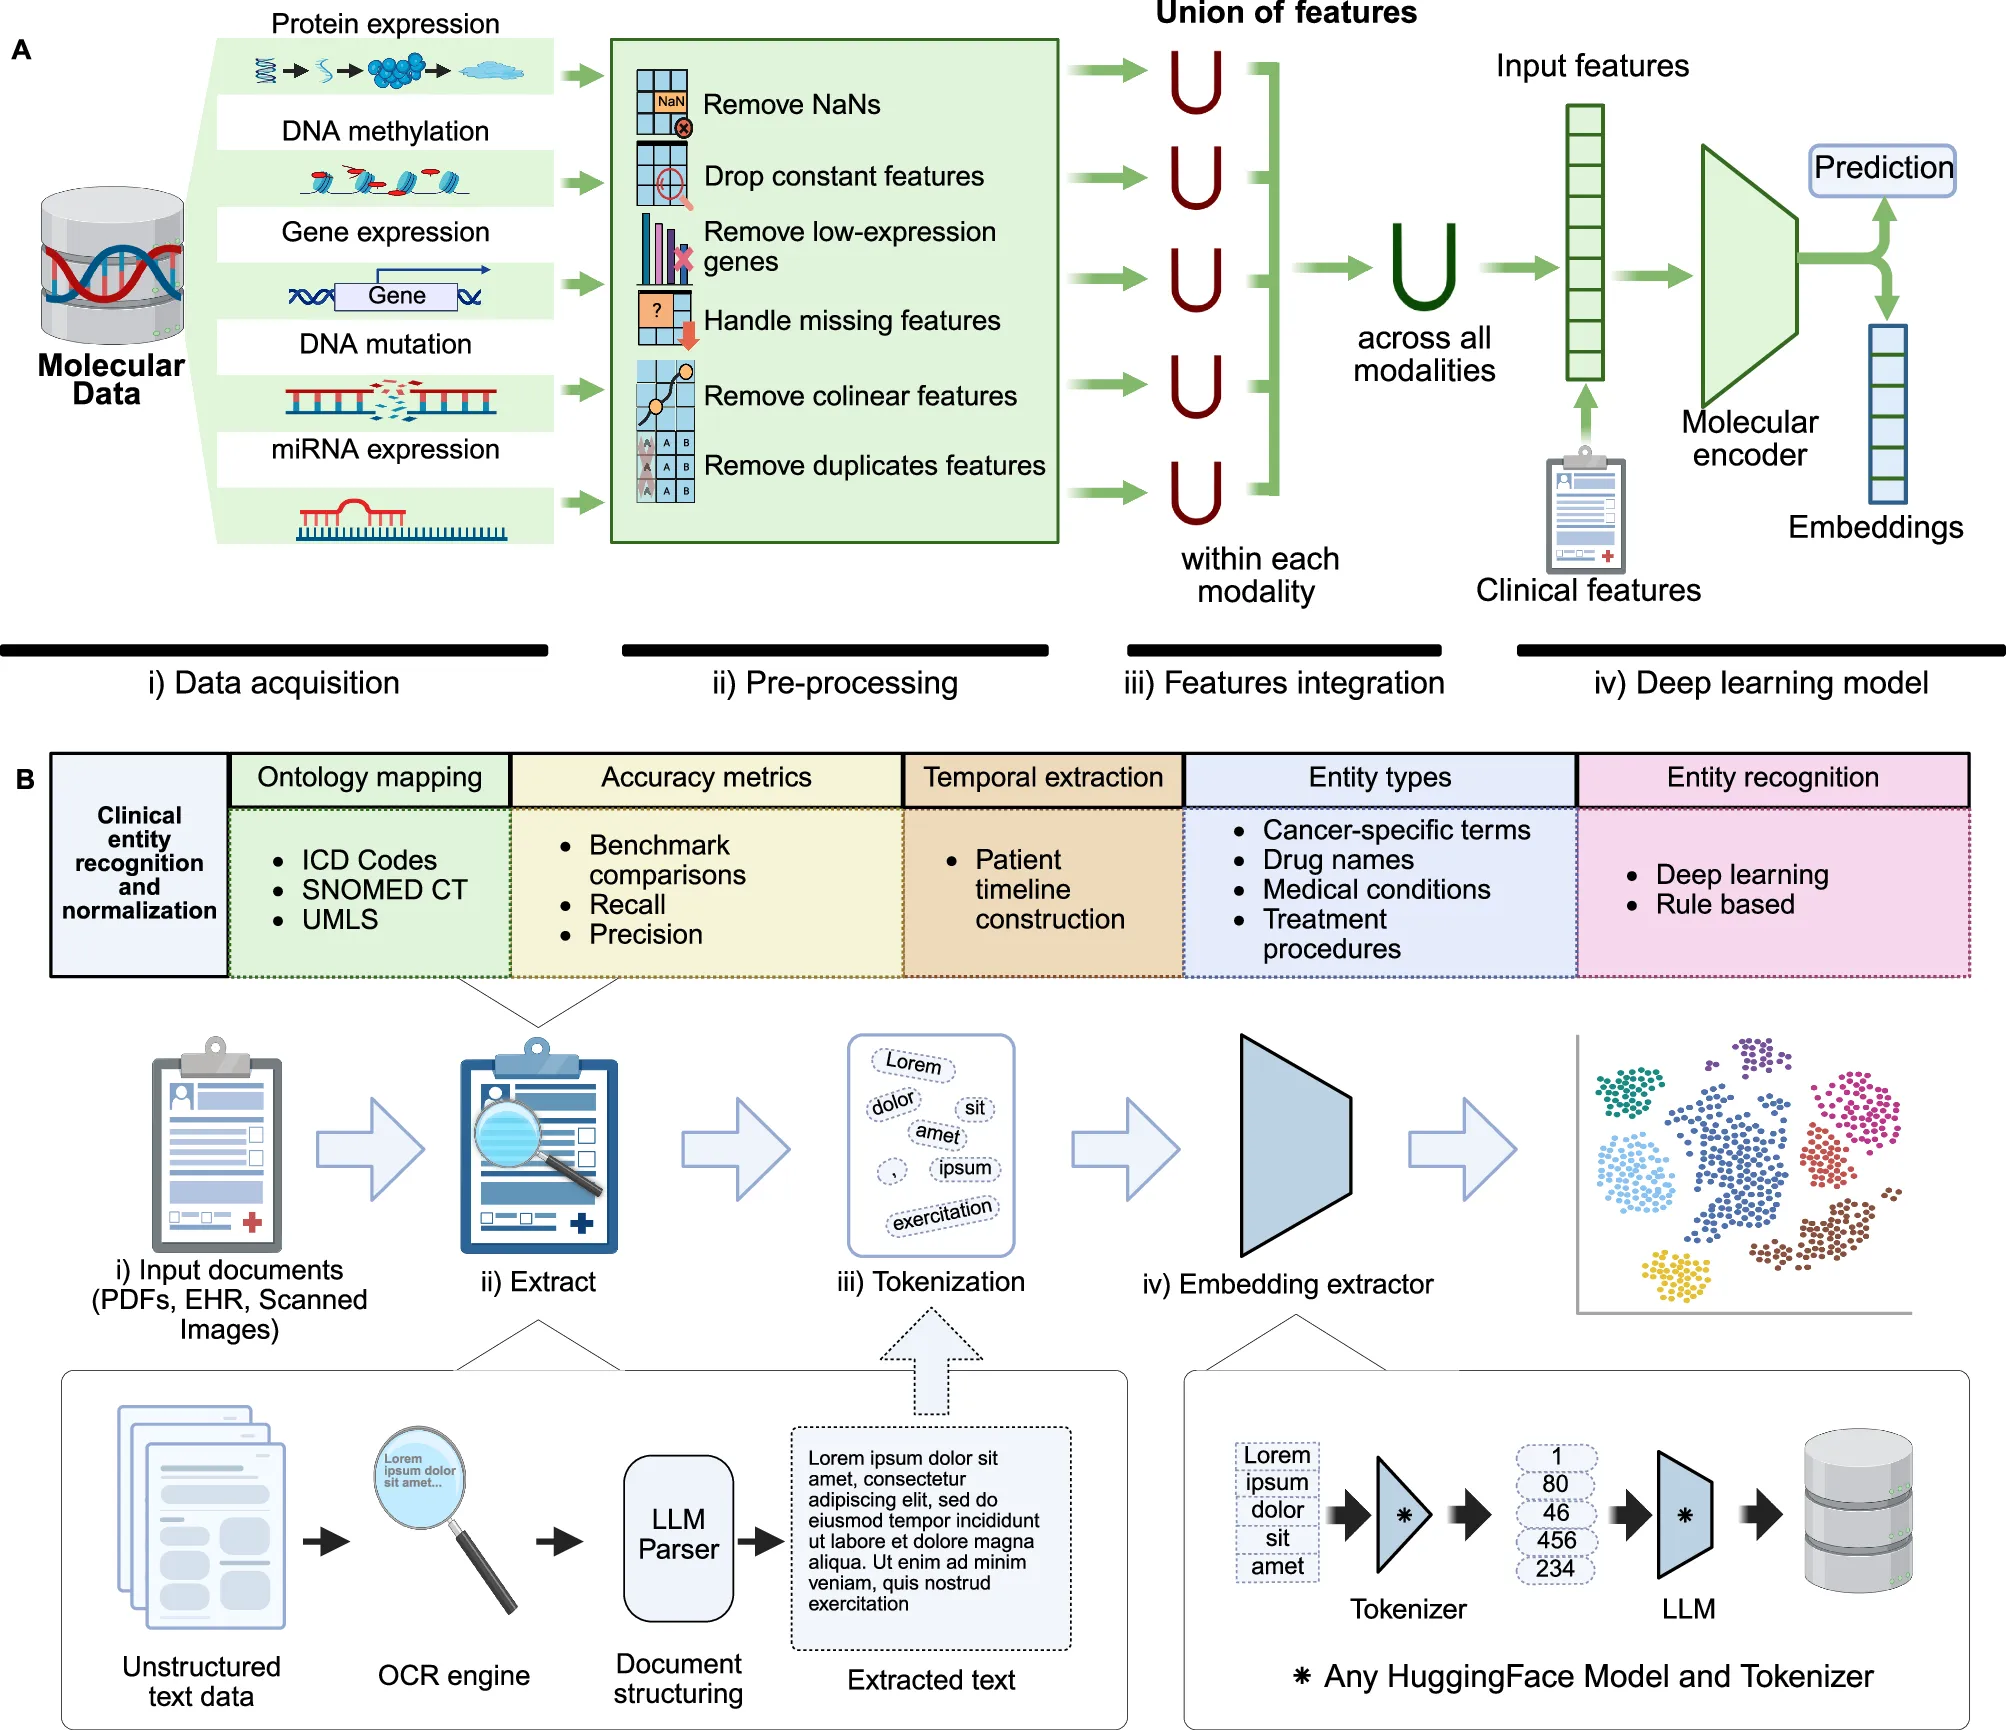
Clinical documents arrive as PDFs, scanned images or EHR exports. Scans go through Tesseract OCR with medical dictionaries, and structured EHR tables become key–value text that a language model can read alongside narrative notes. Long documents are split with sliding windows (typically 10–20% overlap) or section-aware segmentation, and extracted entities can be mapped to SNOMED CT, RxNorm, LOINC and ICD-O-3.
For the primary analyses we embedded clinical text and pathology reports with GatorTron, chosen for its clinical pretraining. The framework also supports Qwen3, Med-Gemma and Llama-3.2, which we compare below.
Pathology slides
Whole-slide images bring their own computational problems: gigapixel size, multi-resolution pyramids and vendor-specific formats. HONeYBEE loads them through CuImage, with GPU-accelerated I/O for Aperio SVS, Philips TIFF and generic tiled TIFF files, and reads regions on demand from the pyramid.
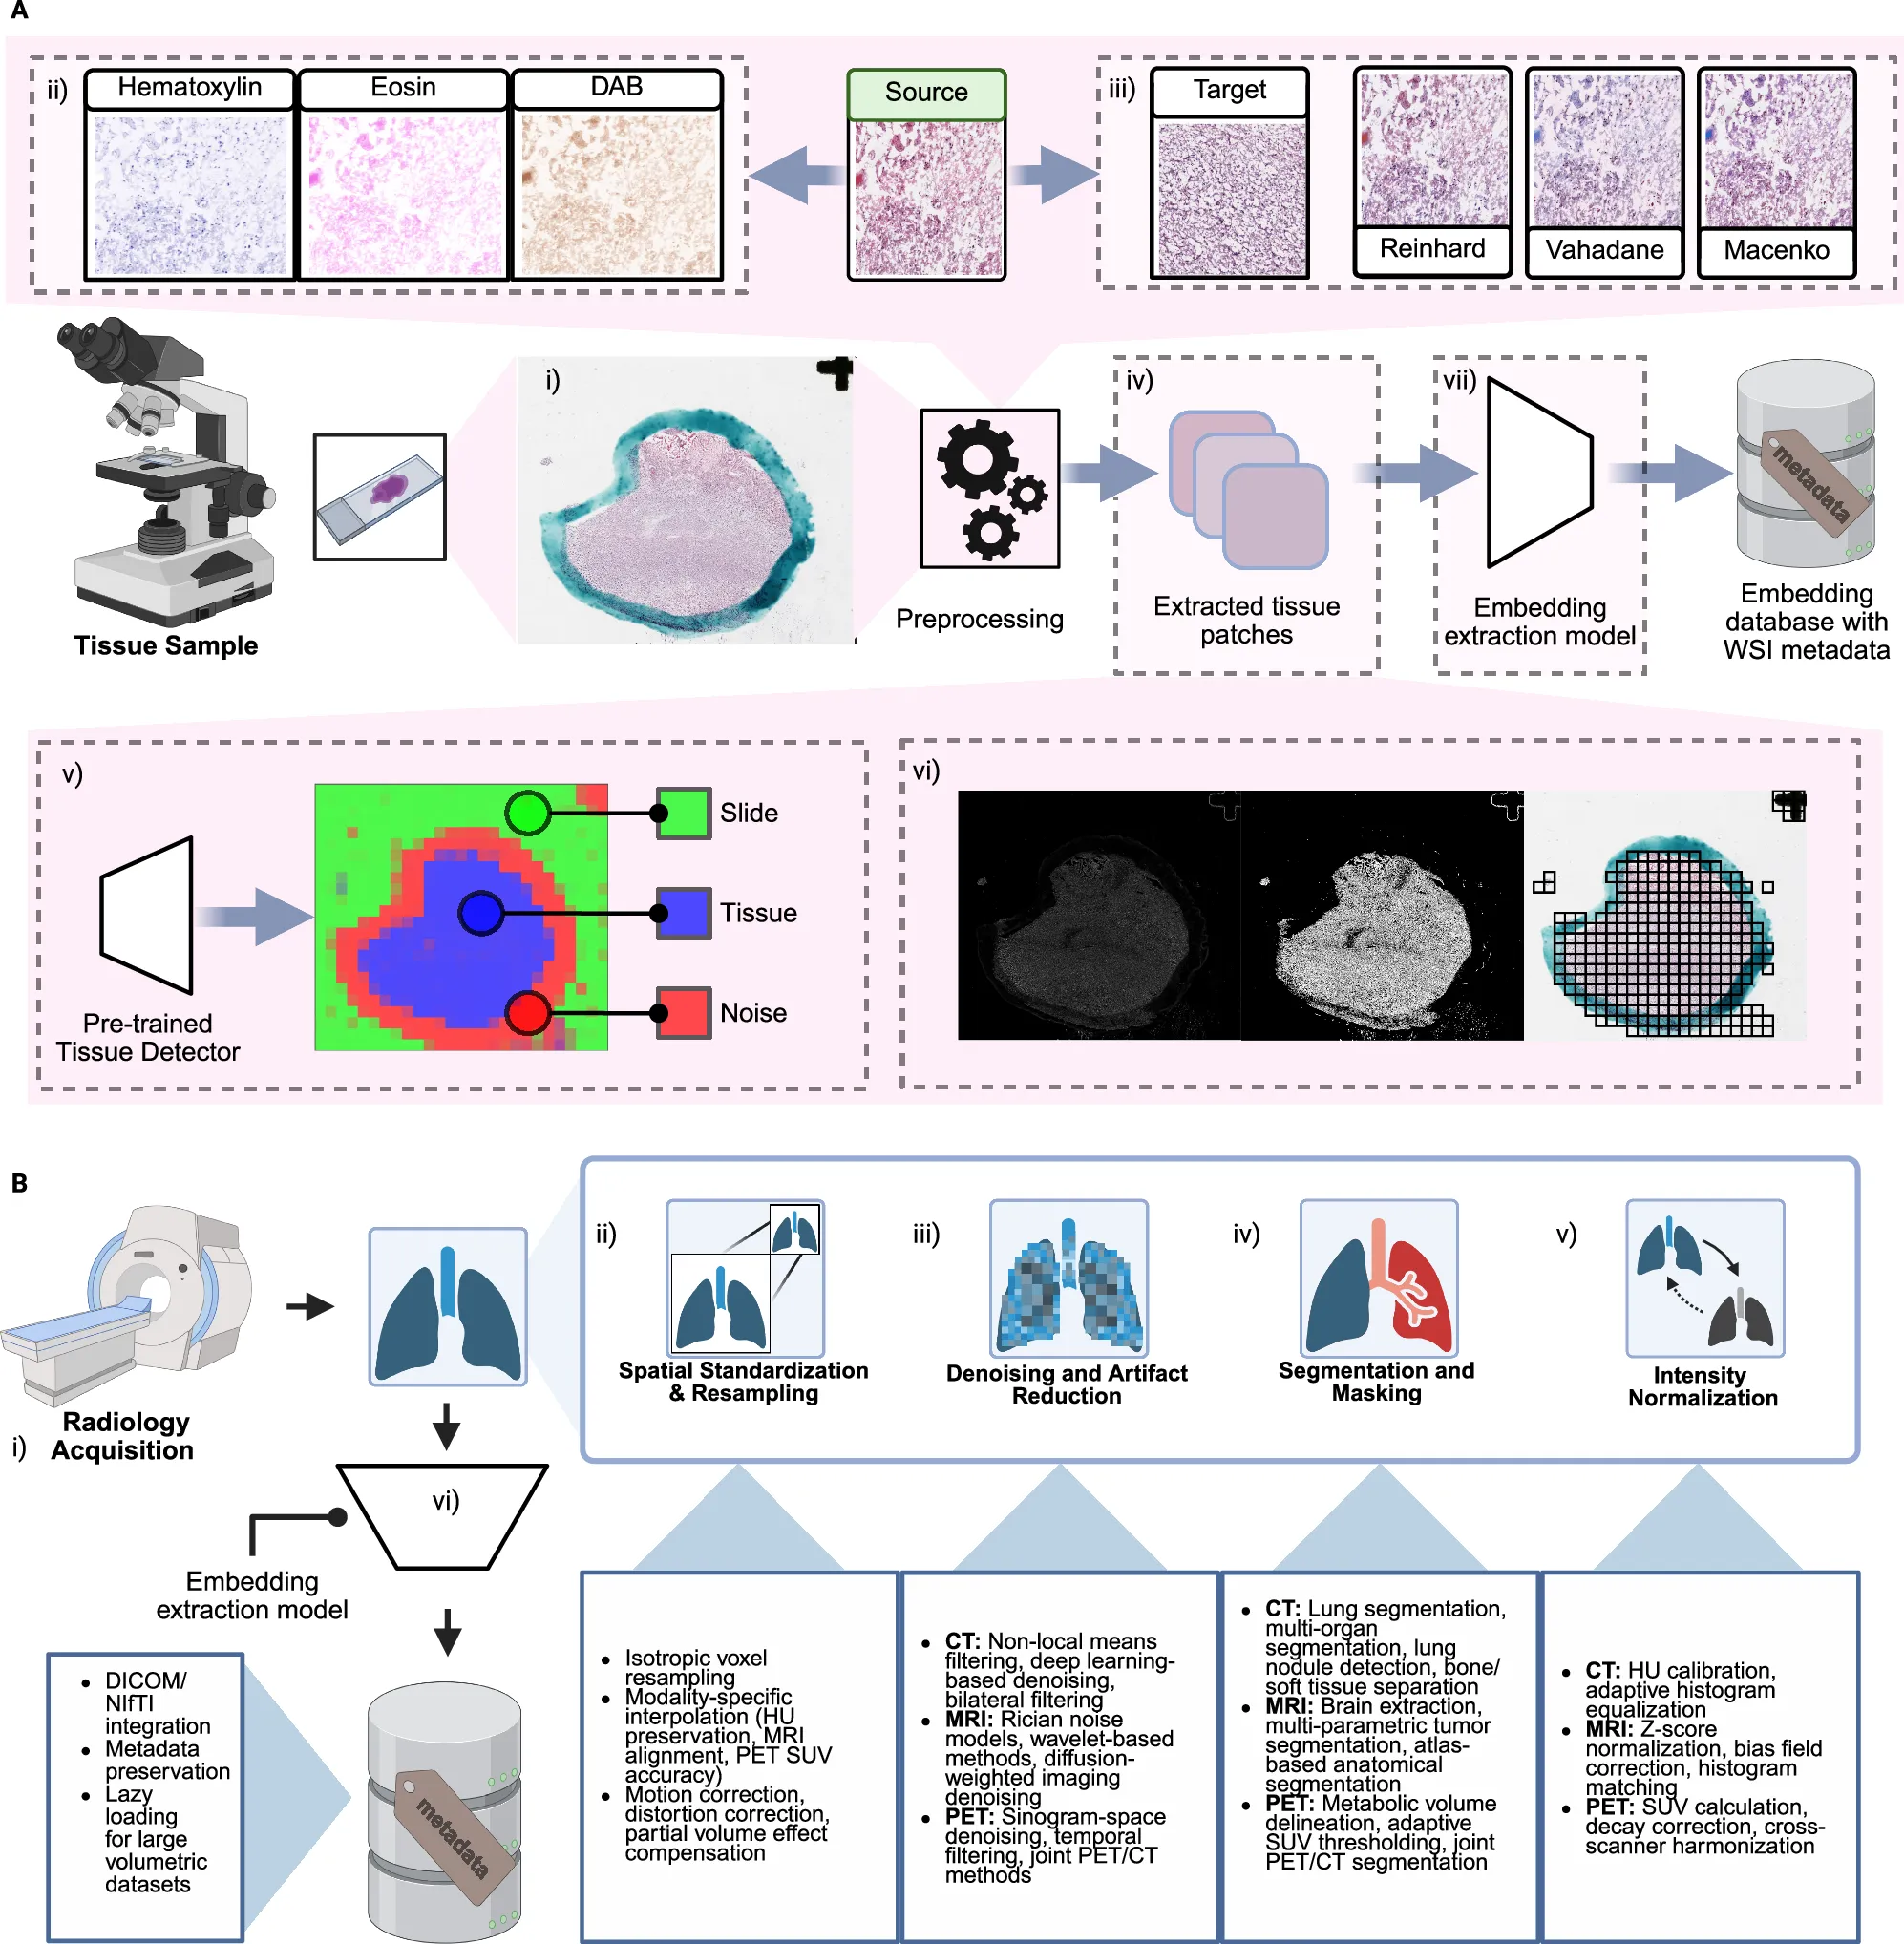
GPU stain normalization gave an average 8–12× speedup over CPU alternatives on typical hardware, and the deep-learning tissue detector also flags artifacts such as pen markings. UNI2-h and Virchow2 are supported as alternatives to UNI; the supplementary material analyzes how stain normalization affects each.
Radiology and molecular data
Radiology images are read from DICOM or NIfTI with acquisition metadata preserved, then resampled, denoised, segmented and intensity-normalized before embedding with RadImageNet, a CNN pretrained on over four million CT, MRI and PET images.
Molecular data (gene expression, DNA methylation, somatic mutations, miRNA and protein expression) follows the preprocessing of SeNMo, a self-normalizing multi-omics encoder from our group, and is embedded with it.5 For patients with several molecular profiles, features are aggregated to the patient level before embedding.
Fusing modalities
Patients rarely have every modality, so the fusion step works over whatever is available for each patient. For a patient with available modality embeddings , the three strategies are (the Kronecker product written for one pair of modalities and ):
Concatenation keeps modality-specific information intact. Mean pooling first pads embeddings to a common dimension and then averages them. The Kronecker product captures pairwise interactions between modalities.
Data and evaluation
All experiments used TCGA, where coverage varies widely by modality, as it does in real-world data.
- TCGA patients
- 11,428
- cancer types
- 33
- data modalities
- 5
- patients with two or more modalities (11,424)
- 99.97%
| Modality | Coverage |
|---|---|
| Clinical text | 11,428 patients |
| Molecular profiles | 13,804 samples from 10,938 patients |
| Pathology reports | 11,108 patients |
| Whole-slide images | 8,060 patients |
| Radiology images | 1,149 patients |
We evaluated four tasks:
- Clustering. Cancer-type separability of each embedding space, measured with normalized and adjusted mutual information (NMI, AMI).
- Classification. Random forests with 100 estimators, an 80/20 stratified split, repeated over 10 random seeds.
- Retrieval. Nearest-neighbor search with FAISS, scored by precision@k, , the fraction of the nearest patients that share the query’s cancer type.
- Survival. Separate models per cancer type (Cox proportional hazards, random survival forests and DeepSurv) with 5-fold cross-validation stratified on outcome and censoring. Small cohorts with similar cancers were merged, such as colon and rectal adenocarcinoma.
Results
Classification and clustering
Clinical embeddings dominated the single-modality results, and concatenation and Kronecker fusion performed on par with them.
Concatenation reached 98.72 ± 0.21% accuracy against 98.54 ± 0.32% for clinical embeddings alone, a marginal gain within one standard deviation, and run-to-run standard deviations stayed under 1% for every method except radiology (± 3.51%). Clustering told a slightly different story: clinical embeddings had the best cancer-type separation (NMI 0.7448, AMI 0.702), while the best fusion strategy, concatenation, reached NMI 0.4440 and AMI 0.347. All three fusion strategies still clustered better than the molecular, radiology or WSI embeddings on their own.
Survival prediction
On breast (BRCA) and bladder (BLCA) cancer, we compared HONeYBEE embeddings with published multimodal survival models.
- Published baselines
- HONeYBEE embeddings
C-index
The baselines ranged from 0.566 to 0.655 across the two cancers. Clinical embeddings reached 0.920 (Cox) and 0.928 (DeepSurv) on BRCA, and 0.823 and 0.842 on BLCA. The same chart shows that the advantage rests on the clinical text: on BRCA, none of the three survival models trained on WSI, molecular or pathology-report embeddings alone exceeded 0.525, close to chance.
Across all 33 cancer types, clinical embeddings exceeded a C-index of 0.80 for 27, with examples such as TCGA-PCPG (0.996 ± 0.007) and TCGA-THCA (0.985 ± 0.003). Some cancers behaved differently. Molecular embeddings were best for kidney chromophobe (TCGA-KICH, 0.725 ± 0.173), and for some cancers fusion beat clinical features alone. The paper’s examples:
| Cancer type | Clinical only | Multimodal fusion |
|---|---|---|
| TCGA-UCS | 0.794 ± 0.101 | 0.836 ± 0.070 |
| TCGA-UVM | 0.844 ± 0.042 | 0.860 ± 0.084 |
| TCGA-THYM | 0.978 ± 0.032 | 0.983 ± 0.033 |
Patient retrieval
For retrieval, fusion hurt. Clinical embeddings reached precision@10 of 0.964, with only 3.6% of queries failing to retrieve a same-type patient in the top 10. Concatenation, the best fusion strategy, reached 0.461, and WSI embeddings 0.143 (85.7% failures). Our reading is that mixing weaker modalities into the vector diluted the clinical signal that nearest-neighbor search depends on.
The most frequent confusions in clinical retrieval were between related cancers: rectal retrieved as colon adenocarcinoma (562 cases), lung adenocarcinoma as squamous cell carcinoma (480) and the reverse (401).
Which language model?
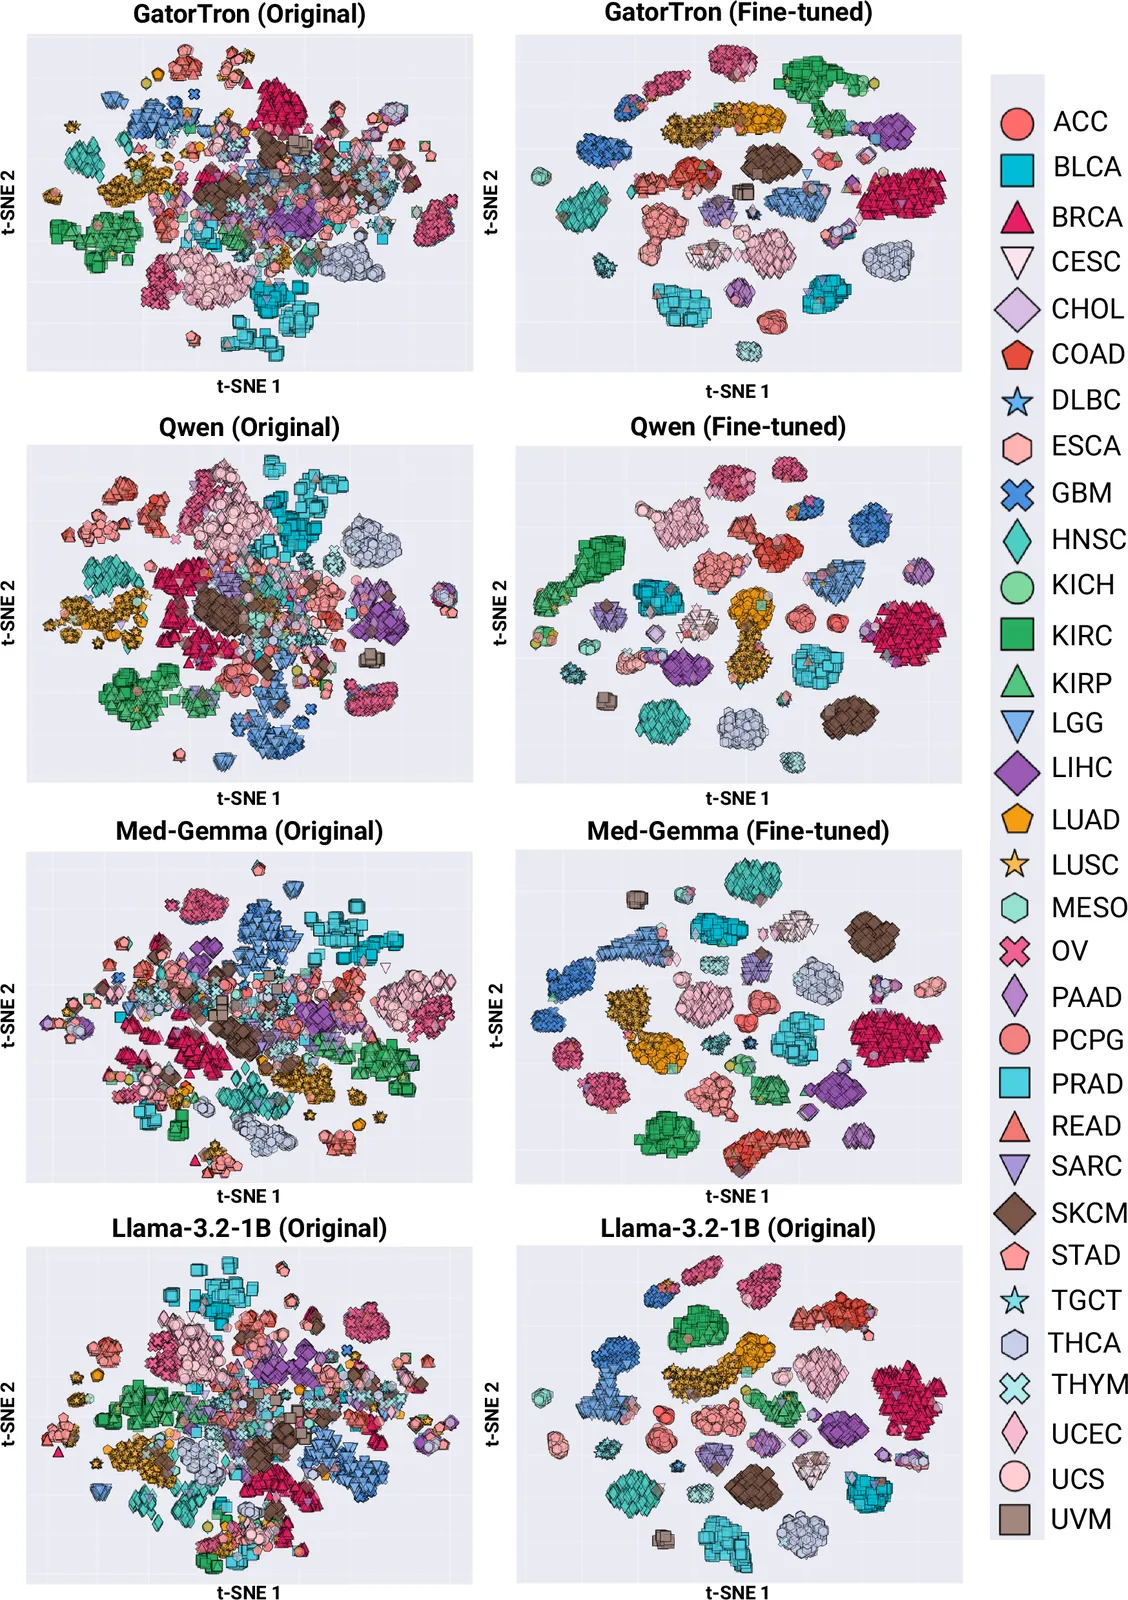
Because clinical text carried so much of the signal, we also compared four language models as text encoders. GatorTron and Med-Gemma are medical models; Qwen3 and Llama-3.2 are general-purpose. Accuracies are random-forest means over 10 runs; the fine-tuned column uses a neural network classifier.
| Model | Clinical accuracy | Clinical P@10 | Pathology-report accuracy | Pathology-report accuracy, fine-tuned |
|---|---|---|---|---|
| GatorTron | 98.66% | 0.964 | 78.41% | 91.07% |
| Qwen3 | 99.95% | 0.996 | 84.90% | 92.73% |
| Med-Gemma | 99.52% | 0.955 | 84.05% | 94.29% |
| Llama-3.2 | 99.49% | 0.965 | 82.45% | 92.96% |
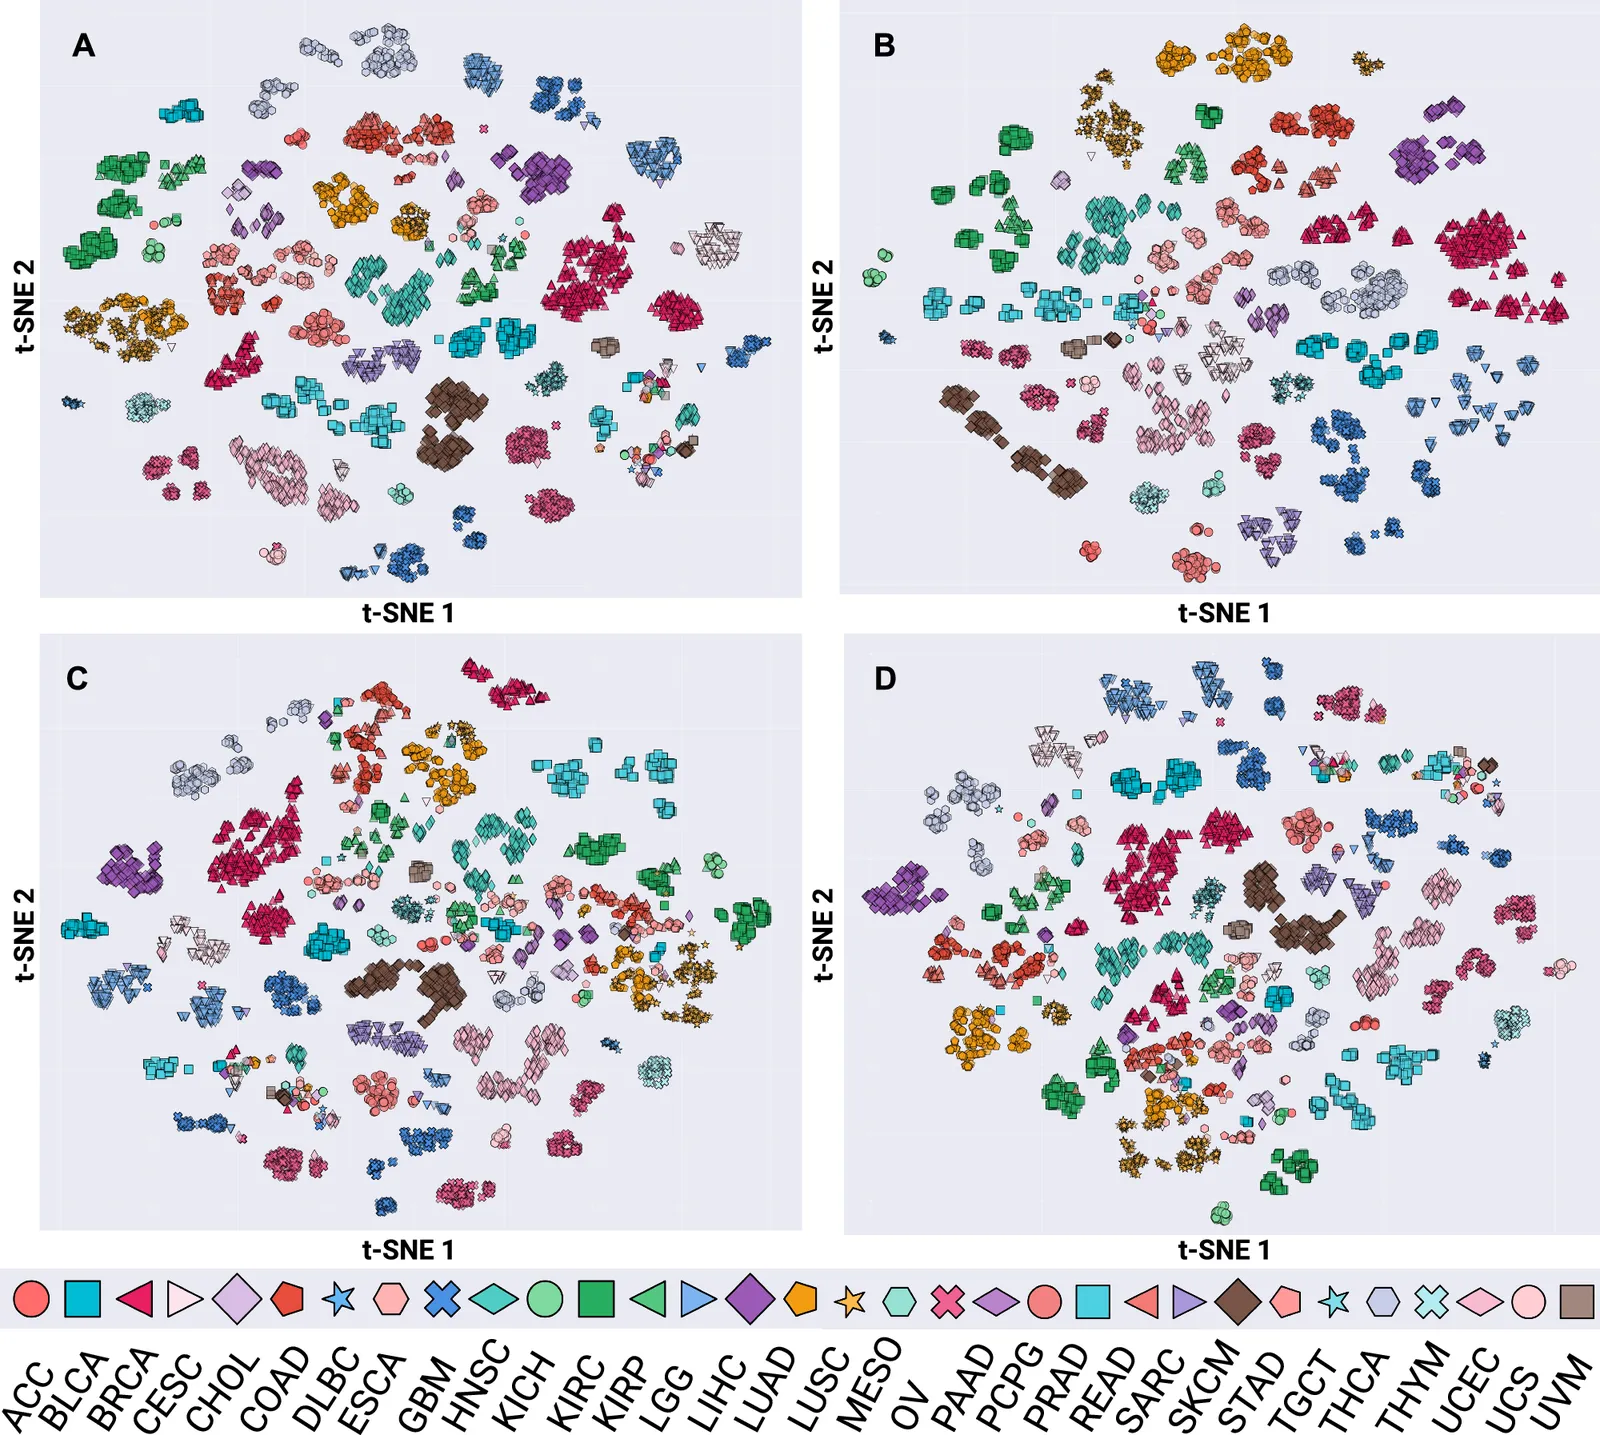
The general-purpose Qwen3 gave the best clinical-text embeddings, with the highest clustering scores (AMI 0.79, NMI 0.82), accuracy and retrieval precision. Pathology reports were harder for every model. Fine-tuning with a small neural network classifier raised pathology-report accuracy by 7.8 to 12.7 percentage points, and AMI rose sharply in the fine-tuned embedding spaces (for example, 0.35 to 0.91 for GatorTron and 0.26 to 0.93 for Med-Gemma). For survival, average clinical-text C-indices across the 33 cancer types were above 0.84 for all four models; pathology-report embeddings stayed around 0.58.
Takeaways
In TCGA, clinical text is the strongest single signal for cancer type, retrieval and survival. That is also the most TCGA-specific result: TCGA clinical records are curated summaries in which experts have already recorded subtype, stage, grade and molecular markers, condensing information spread across the imaging, pathology and molecular data. Routine records are messier, and that is where we expect fusion to matter more.
Read these results with care
- Curated clinical text. Clinical-embedding results may not transfer to routine documentation.
- Simple slide aggregation. WSI embeddings are mean-pooled UNI patch features, a baseline rather than a multiple-instance learning model.
- Sparse radiology. Radiology covered 1,149 patients, and radiology embeddings were available for only four cancer types in the survival analysis.
- Weak pathology-report survival signal. Pathology-report embeddings averaged a C-index of about 0.58, suggesting that frozen language-model embeddings may not fully capture the prognostic content of these reports.
Two practical lessons came out of the work. First, the right fusion depends on the task: concatenation slightly improved classification and improved survival prediction for some cancers, but it hurt retrieval. Second, for heterogeneous text such as pathology reports, task-specific adaptation mattered more than the choice of encoder: fine-tuning added 7.8 to 12.7 points of accuracy, more than the 6.49-point spread between the four models before fine-tuning.
What’s next
The paper lists three directions: applying HONeYBEE to prospective clinical data, testing embeddings for treatment-response prediction, and adding modalities such as genomics, radiomics and wearable-sensor data. Because embeddings can be generated locally without sharing raw data, the framework could also support federated, multi-institution collaborations.
A real-world evaluation is reported in an AACR Annual Meeting 2026 abstract.6 We adapted HONeYBEE to routine data from a single NCI-designated cancer center: glioblastoma (n=160), non-small cell lung cancer (n=580) and pancreatic ductal adenocarcinoma (n=171), with 8.2–47% missing data. Using cross-modal attention over HONeYBEE embeddings (the approach described in the EAGLE post), the cross-validated C-indices were 0.637 ± 0.087 (GBM), 0.598 ± 0.021 (NSCLC) and 0.679 ± 0.029 (PDAC). Attribution analysis showed different modality mixes by disease: text reports contributed most for GBM (43.7%), imaging for NSCLC (49%), and PDAC was balanced (31–35% per modality).
The framework was the subject of a workshop at the Mayo Clinic AI Summit on July 8, 2025 (Scalable Multimodal AI in Oncology Using HONeYBEE: From Embeddings to Clinical Impact), where I served as a teaching assistant. The HONeYBEE poster won the Best Poster Award at the 2024 Dr. Robert Gillies Machine Learning Workshop in Cancer.
Resources
The package is on PyPI and the embeddings are on Hugging Face.7 To install the framework:
pip install honeybee-ml
python -c "import nltk; nltk.download('punkt'); nltk.download('punkt_tab')"
In the precomputed TCGA embeddings, each modality is a config and each encoder is a split:
from datasets import load_dataset
import numpy as np

clinical = load_dataset("Lab-Rasool/TCGA", "clinical", split="gatortron")
item = clinical[0]
embedding = np.frombuffer(item["embedding"], dtype=np.float32).reshape(item["embedding_shape"])- Paper: npj Digital Medicine 8, 622 (2025), open access.1
- Code and docs: github.com/lab-rasool/HoneyBee and lab-rasool.github.io/HoneyBee
- Embeddings: Lab-Rasool/TCGA. The paper also points to CGCI, CPTAC, TARGET and Foundation Medicine datasets, collected in the HONeYBEE collection.
- Raw data tooling: MINDS3
The paper is a team effort. Asim Waqas (co-first author) led molecular data processing and contributed to the molecular model development, Matthew B. Schabath provided clinical expertise and validated the findings’ clinical relevance, Yasin Yilmaz guided algorithm design and statistics, and Ghulam Rasool conceived and supervised the study. The work was supported by NSF Awards 2234836 and 2234468 and NAIRR pilot funding.
References
-
Tripathi A, Waqas A, Schabath MB, Yilmaz Y, Rasool G. HONeYBEE: enabling scalable multimodal AI in oncology through foundation model-driven embeddings. npj Digital Medicine. 2025;8:622. doi.org/10.1038/s41746-025-02003-4 ↩ ↩2
-
Tripathi A, Waqas A, Schabath MB, Yilmaz Y, Rasool G. HoneyBee: A Scalable Modular Framework for Creating Multimodal Oncology Datasets with Foundational Embedding Models. arXiv:2405.07460, 2024. arxiv.org/abs/2405.07460 ↩
-
Tripathi A, Waqas A, Venkatesan K, Yilmaz Y, Rasool G. Building Flexible, Scalable, and Machine Learning-Ready Multimodal Oncology Datasets. Sensors. 2024;24(5):1634. doi.org/10.3390/s24051634 ↩ ↩2
-
Lab Rasool. TCGA multimodal embeddings dataset (GatorTron, Med-Gemma, Qwen, Llama, UNI, SeNMo, REMEDIS and RadImageNet embeddings). huggingface.co/datasets/Lab-Rasool/TCGA ↩
-
Waqas A, Tripathi A, Ahmed S, Mukund A, Farooq H, Johnson JO, Stewart PA, Naeini M, Schabath MB, Rasool G. Self-Normalizing Multi-Omics Neural Network for Pan-Cancer Prognostication. International Journal of Molecular Sciences. 2025;26(15):7358. doi.org/10.3390/ijms26157358 ↩
-
Tripathi AG, Waqas A, Davis EW, Permuth JB, Farinhas J, Yilmaz Y, Schabath MB, Rasool G. Real-world evaluation of multimodal AI: Foundation model-driven multimodal AI for GBM, NSCLC, and PDAC. Cancer Research. 2026;86(7 Suppl):1251. AACR Annual Meeting 2026. doi.org/10.1158/1538-7445.AM2026-1251 ↩
-
HONeYBEE source code: github.com/lab-rasool/HoneyBee; Python package: pypi.org/project/honeybee-ml. ↩
Cite the paper
Tripathi A, Waqas A, Schabath MB, Yilmaz Y, Rasool G. HONeYBEE: enabling scalable multimodal AI in oncology through foundation model-driven embeddings. NPJ Digit Med. 2025;8:622. doi:10.1038/s41746-025-02003-4
@article{tripathi2025honeybee,
  title   = {{HONeYBEE}: enabling scalable multimodal {AI} in oncology through foundation model-driven embeddings},
  author  = {Tripathi, Aakash and Waqas, Asim and Schabath, Matthew B. and Yilmaz, Yasin and Rasool, Ghulam},
  journal = {npj Digital Medicine},
  year    = {2025},
  volume  = {8},
  pages   = {622},
  doi     = {10.1038/s41746-025-02003-4}
}